Immigrants from Canada vs Immigrants from England No Schooling Completed
COMPARE
Immigrants from Canada
Immigrants from England
No Schooling Completed
No Schooling Completed Comparison
Immigrants from Canada
Immigrants from England
1.6%
NO SCHOOLING COMPLETED
99.8/ 100
METRIC RATING
52nd/ 347
METRIC RANK
1.7%
NO SCHOOLING COMPLETED
99.5/ 100
METRIC RATING
71st/ 347
METRIC RANK
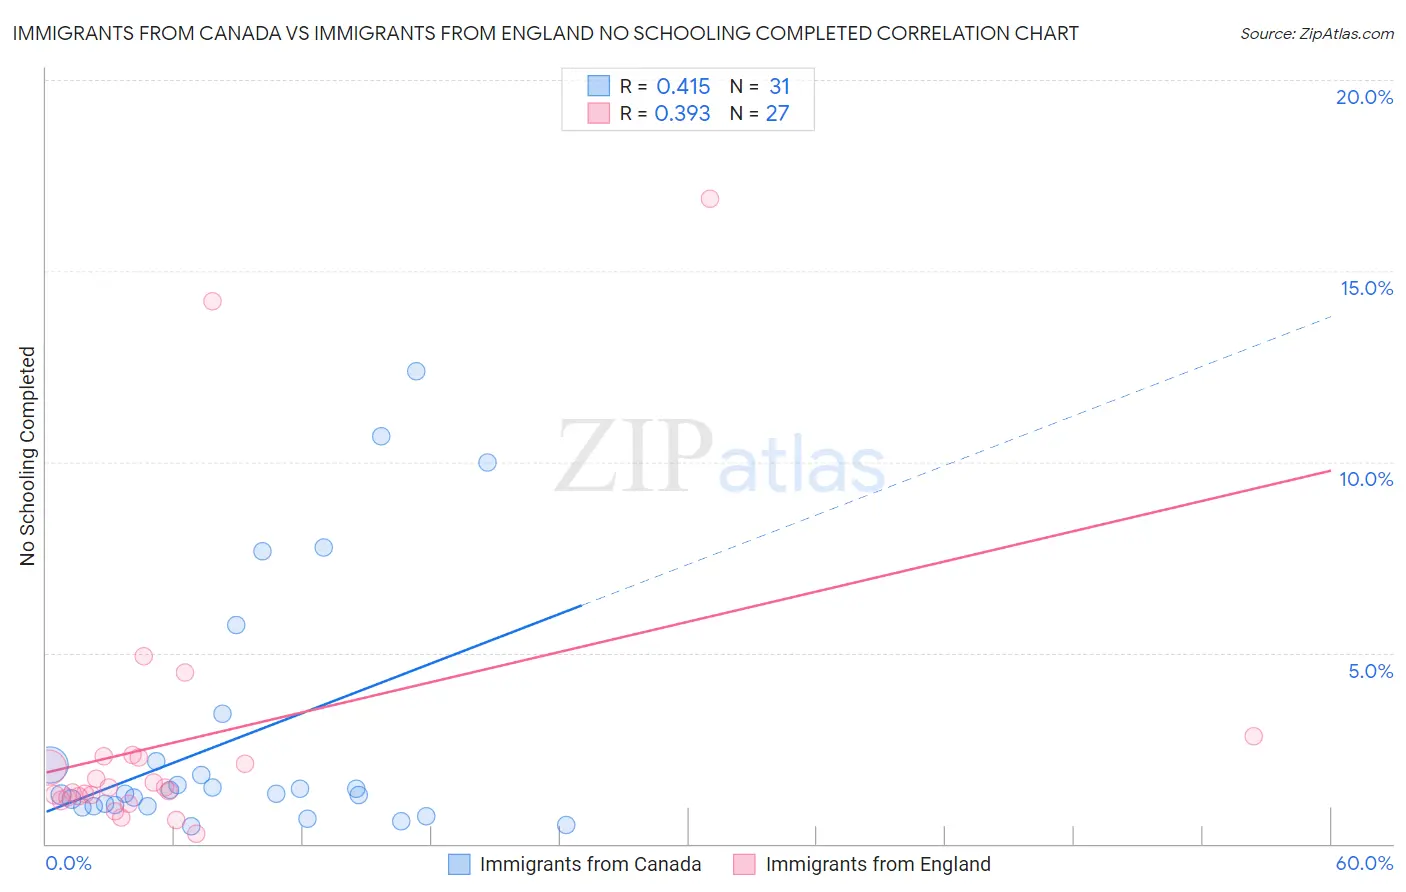
Immigrants from Canada vs Immigrants from England No Schooling Completed Correlation Chart
The statistical analysis conducted on geographies consisting of 451,468,489 people shows a moderate positive correlation between the proportion of Immigrants from Canada and percentage of population with no schooling in the United States with a correlation coefficient (R) of 0.415 and weighted average of 1.6%. Similarly, the statistical analysis conducted on geographies consisting of 387,063,522 people shows a mild positive correlation between the proportion of Immigrants from England and percentage of population with no schooling in the United States with a correlation coefficient (R) of 0.393 and weighted average of 1.7%, a difference of 4.9%.
No Schooling Completed Correlation Summary
| Measurement | Immigrants from Canada | Immigrants from England |
| Minimum | 0.45% | 0.25% |
| Maximum | 12.4% | 16.9% |
| Range | 11.9% | 16.7% |
| Mean | 2.8% | 2.7% |
| Median | 1.3% | 1.5% |
| Interquartile 25% (IQ1) | 0.99% | 1.2% |
| Interquartile 75% (IQ3) | 2.2% | 2.3% |
| Interquartile Range (IQR) | 1.2% | 1.1% |
| Standard Deviation (Sample) | 3.3% | 3.8% |
| Standard Deviation (Population) | 3.3% | 3.8% |
Demographics Similar to Immigrants from Canada and Immigrants from England by No Schooling Completed
In terms of no schooling completed, the demographic groups most similar to Immigrants from Canada are Chippewa (1.6%, a difference of 0.070%), Creek (1.6%, a difference of 0.13%), Crow (1.6%, a difference of 0.16%), Greek (1.6%, a difference of 0.28%), and Immigrants from North America (1.6%, a difference of 0.28%). Similarly, the demographic groups most similar to Immigrants from England are Immigrants from Netherlands (1.7%, a difference of 0.34%), Chickasaw (1.7%, a difference of 1.3%), Immigrants from Lithuania (1.7%, a difference of 1.6%), Immigrants from Austria (1.7%, a difference of 2.4%), and Canadian (1.7%, a difference of 2.5%).
| Demographics | Rating | Rank | No Schooling Completed |
| Chippewa | 99.8 /100 | #51 | Exceptional 1.6% |
| Immigrants | Canada | 99.8 /100 | #52 | Exceptional 1.6% |
| Creek | 99.8 /100 | #53 | Exceptional 1.6% |
| Crow | 99.8 /100 | #54 | Exceptional 1.6% |
| Greeks | 99.8 /100 | #55 | Exceptional 1.6% |
| Immigrants | North America | 99.8 /100 | #56 | Exceptional 1.6% |
| Austrians | 99.8 /100 | #57 | Exceptional 1.6% |
| Kiowa | 99.8 /100 | #58 | Exceptional 1.6% |
| Slavs | 99.8 /100 | #59 | Exceptional 1.7% |
| Americans | 99.8 /100 | #60 | Exceptional 1.7% |
| Tsimshian | 99.8 /100 | #61 | Exceptional 1.7% |
| Immigrants | Northern Europe | 99.8 /100 | #62 | Exceptional 1.7% |
| Russians | 99.8 /100 | #63 | Exceptional 1.7% |
| New Zealanders | 99.7 /100 | #64 | Exceptional 1.7% |
| Serbians | 99.7 /100 | #65 | Exceptional 1.7% |
| Canadians | 99.7 /100 | #66 | Exceptional 1.7% |
| Immigrants | Austria | 99.7 /100 | #67 | Exceptional 1.7% |
| Immigrants | Lithuania | 99.7 /100 | #68 | Exceptional 1.7% |
| Chickasaw | 99.6 /100 | #69 | Exceptional 1.7% |
| Immigrants | Netherlands | 99.6 /100 | #70 | Exceptional 1.7% |
| Immigrants | England | 99.5 /100 | #71 | Exceptional 1.7% |