Immigrants from England vs Puerto Rican 11th Grade
COMPARE
Immigrants from England
Puerto Rican
11th Grade
11th Grade Comparison
Immigrants from England
Puerto Ricans
93.8%
11TH GRADE
99.7/ 100
METRIC RATING
70th/ 347
METRIC RANK
88.4%
11TH GRADE
0.0/ 100
METRIC RATING
322nd/ 347
METRIC RANK
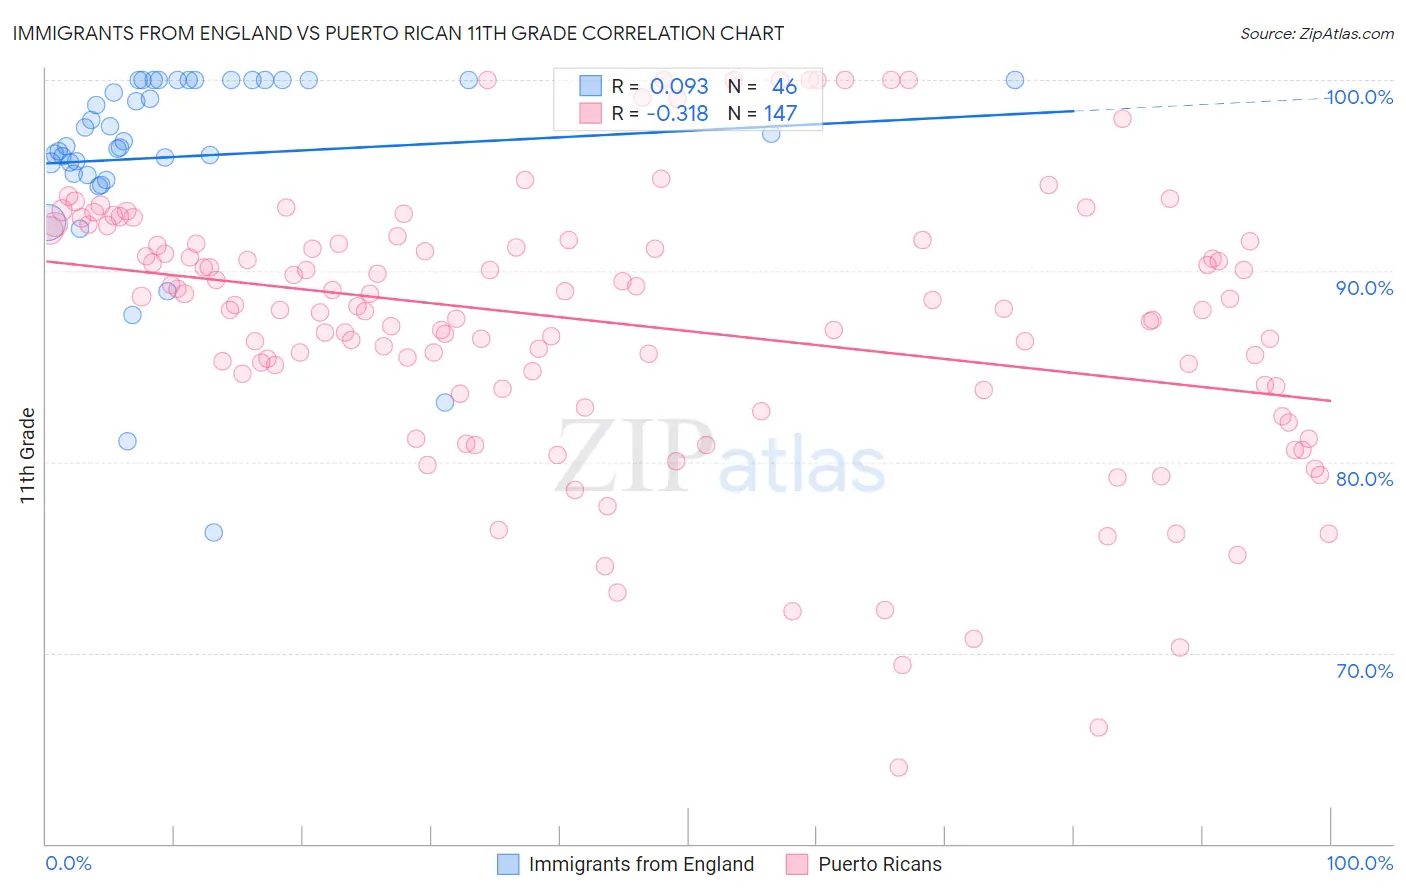
Immigrants from England vs Puerto Rican 11th Grade Correlation Chart
The statistical analysis conducted on geographies consisting of 391,897,612 people shows a slight positive correlation between the proportion of Immigrants from England and percentage of population with at least 11th grade education in the United States with a correlation coefficient (R) of 0.093 and weighted average of 93.8%. Similarly, the statistical analysis conducted on geographies consisting of 528,320,613 people shows a mild negative correlation between the proportion of Puerto Ricans and percentage of population with at least 11th grade education in the United States with a correlation coefficient (R) of -0.318 and weighted average of 88.4%, a difference of 6.2%.
11th Grade Correlation Summary
| Measurement | Immigrants from England | Puerto Rican |
| Minimum | 76.3% | 64.0% |
| Maximum | 100.0% | 100.0% |
| Range | 23.7% | 36.0% |
| Mean | 96.0% | 87.3% |
| Median | 96.7% | 88.0% |
| Interquartile 25% (IQ1) | 95.1% | 83.8% |
| Interquartile 75% (IQ3) | 100.0% | 91.6% |
| Interquartile Range (IQR) | 4.9% | 7.7% |
| Standard Deviation (Sample) | 5.2% | 7.1% |
| Standard Deviation (Population) | 5.1% | 7.1% |
Similar Demographics by 11th Grade
Demographics Similar to Immigrants from England by 11th Grade
In terms of 11th grade, the demographic groups most similar to Immigrants from England are Immigrants from South Africa (93.8%, a difference of 0.010%), Immigrants from Japan (93.8%, a difference of 0.040%), Zimbabwean (93.9%, a difference of 0.060%), Scotch-Irish (93.9%, a difference of 0.060%), and Romanian (93.8%, a difference of 0.060%).
| Demographics | Rating | Rank | 11th Grade |
| Ukrainians | 99.8 /100 | #63 | Exceptional 94.0% |
| Immigrants | Sweden | 99.8 /100 | #64 | Exceptional 93.9% |
| Native Hawaiians | 99.8 /100 | #65 | Exceptional 93.9% |
| Alaskan Athabascans | 99.8 /100 | #66 | Exceptional 93.9% |
| Immigrants | Netherlands | 99.8 /100 | #67 | Exceptional 93.9% |
| Zimbabweans | 99.8 /100 | #68 | Exceptional 93.9% |
| Scotch-Irish | 99.8 /100 | #69 | Exceptional 93.9% |
| Immigrants | England | 99.7 /100 | #70 | Exceptional 93.8% |
| Immigrants | South Africa | 99.7 /100 | #71 | Exceptional 93.8% |
| Immigrants | Japan | 99.7 /100 | #72 | Exceptional 93.8% |
| Romanians | 99.6 /100 | #73 | Exceptional 93.8% |
| Immigrants | Czechoslovakia | 99.6 /100 | #74 | Exceptional 93.8% |
| Immigrants | Latvia | 99.6 /100 | #75 | Exceptional 93.8% |
| Celtics | 99.5 /100 | #76 | Exceptional 93.7% |
| Aleuts | 99.5 /100 | #77 | Exceptional 93.7% |
Demographics Similar to Puerto Ricans by 11th Grade
In terms of 11th grade, the demographic groups most similar to Puerto Ricans are Pima (88.3%, a difference of 0.080%), Central American Indian (88.2%, a difference of 0.12%), Immigrants from Nicaragua (88.1%, a difference of 0.25%), Immigrants from Belize (88.7%, a difference of 0.39%), and Immigrants from Armenia (88.8%, a difference of 0.48%).
| Demographics | Rating | Rank | 11th Grade |
| Immigrants | Ecuador | 0.0 /100 | #315 | Tragic 89.1% |
| Immigrants | Cuba | 0.0 /100 | #316 | Tragic 88.9% |
| Lumbee | 0.0 /100 | #317 | Tragic 88.9% |
| Nicaraguans | 0.0 /100 | #318 | Tragic 88.9% |
| Belizeans | 0.0 /100 | #319 | Tragic 88.8% |
| Immigrants | Armenia | 0.0 /100 | #320 | Tragic 88.8% |
| Immigrants | Belize | 0.0 /100 | #321 | Tragic 88.7% |
| Puerto Ricans | 0.0 /100 | #322 | Tragic 88.4% |
| Pima | 0.0 /100 | #323 | Tragic 88.3% |
| Central American Indians | 0.0 /100 | #324 | Tragic 88.2% |
| Immigrants | Nicaragua | 0.0 /100 | #325 | Tragic 88.1% |
| Dominicans | 0.0 /100 | #326 | Tragic 87.7% |
| Immigrants | Cabo Verde | 0.0 /100 | #327 | Tragic 87.6% |
| Tohono O'odham | 0.0 /100 | #328 | Tragic 87.6% |
| Mexican American Indians | 0.0 /100 | #329 | Tragic 87.5% |