Immigrants from Ecuador vs Immigrants from Malaysia 1st Grade
COMPARE
Immigrants from Ecuador
Immigrants from Malaysia
1st Grade
1st Grade Comparison
Immigrants from Ecuador
Immigrants from Malaysia
96.9%
1ST GRADE
0.0/ 100
METRIC RATING
316th/ 347
METRIC RANK
97.6%
1ST GRADE
2.1/ 100
METRIC RATING
235th/ 347
METRIC RANK
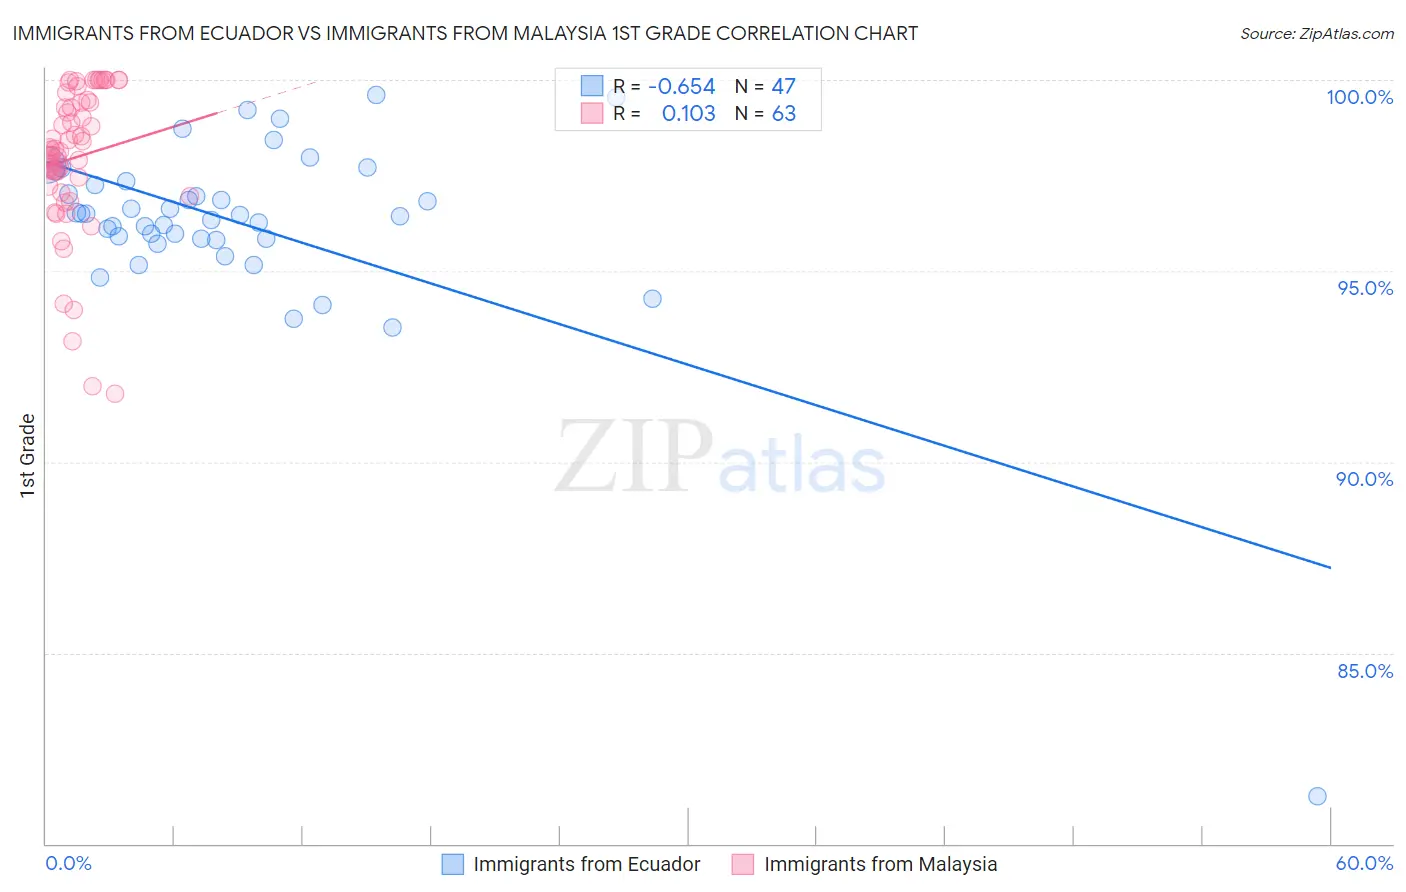
Immigrants from Ecuador vs Immigrants from Malaysia 1st Grade Correlation Chart
The statistical analysis conducted on geographies consisting of 271,020,679 people shows a significant negative correlation between the proportion of Immigrants from Ecuador and percentage of population with at least 1st grade education in the United States with a correlation coefficient (R) of -0.654 and weighted average of 96.9%. Similarly, the statistical analysis conducted on geographies consisting of 197,973,709 people shows a poor positive correlation between the proportion of Immigrants from Malaysia and percentage of population with at least 1st grade education in the United States with a correlation coefficient (R) of 0.103 and weighted average of 97.6%, a difference of 0.80%.
1st Grade Correlation Summary
| Measurement | Immigrants from Ecuador | Immigrants from Malaysia |
| Minimum | 81.2% | 91.8% |
| Maximum | 99.6% | 100.0% |
| Range | 18.3% | 8.2% |
| Mean | 96.3% | 98.0% |
| Median | 96.5% | 98.2% |
| Interquartile 25% (IQ1) | 95.8% | 97.2% |
| Interquartile 75% (IQ3) | 97.3% | 99.4% |
| Interquartile Range (IQR) | 1.5% | 2.2% |
| Standard Deviation (Sample) | 2.6% | 1.9% |
| Standard Deviation (Population) | 2.6% | 1.9% |
Similar Demographics by 1st Grade
Demographics Similar to Immigrants from Ecuador by 1st Grade
In terms of 1st grade, the demographic groups most similar to Immigrants from Ecuador are Immigrants from Nicaragua (96.9%, a difference of 0.0%), Immigrants from Belize (96.9%, a difference of 0.010%), Honduran (96.9%, a difference of 0.020%), Cape Verdean (96.9%, a difference of 0.040%), and Guyanese (96.9%, a difference of 0.040%).
| Demographics | Rating | Rank | 1st Grade |
| Immigrants | Haiti | 0.0 /100 | #309 | Tragic 96.9% |
| Immigrants | Azores | 0.0 /100 | #310 | Tragic 96.9% |
| Sri Lankans | 0.0 /100 | #311 | Tragic 96.9% |
| Cape Verdeans | 0.0 /100 | #312 | Tragic 96.9% |
| Guyanese | 0.0 /100 | #313 | Tragic 96.9% |
| Hondurans | 0.0 /100 | #314 | Tragic 96.9% |
| Immigrants | Belize | 0.0 /100 | #315 | Tragic 96.9% |
| Immigrants | Ecuador | 0.0 /100 | #316 | Tragic 96.9% |
| Immigrants | Nicaragua | 0.0 /100 | #317 | Tragic 96.9% |
| Immigrants | Laos | 0.0 /100 | #318 | Tragic 96.8% |
| Immigrants | Guyana | 0.0 /100 | #319 | Tragic 96.8% |
| Immigrants | Burma/Myanmar | 0.0 /100 | #320 | Tragic 96.8% |
| Immigrants | Bangladesh | 0.0 /100 | #321 | Tragic 96.8% |
| Mexican American Indians | 0.0 /100 | #322 | Tragic 96.8% |
| Immigrants | Honduras | 0.0 /100 | #323 | Tragic 96.8% |
Demographics Similar to Immigrants from Malaysia by 1st Grade
In terms of 1st grade, the demographic groups most similar to Immigrants from Malaysia are Immigrants from Pakistan (97.6%, a difference of 0.0%), Colombian (97.6%, a difference of 0.0%), Immigrants from Western Asia (97.6%, a difference of 0.0%), Immigrants from Uruguay (97.6%, a difference of 0.010%), and U.S. Virgin Islander (97.6%, a difference of 0.010%).
| Demographics | Rating | Rank | 1st Grade |
| Sub-Saharan Africans | 3.6 /100 | #228 | Tragic 97.7% |
| Immigrants | Costa Rica | 3.5 /100 | #229 | Tragic 97.7% |
| Senegalese | 3.5 /100 | #230 | Tragic 97.7% |
| Puerto Ricans | 3.0 /100 | #231 | Tragic 97.7% |
| Immigrants | Uruguay | 2.5 /100 | #232 | Tragic 97.6% |
| Immigrants | Pakistan | 2.2 /100 | #233 | Tragic 97.6% |
| Colombians | 2.2 /100 | #234 | Tragic 97.6% |
| Immigrants | Malaysia | 2.1 /100 | #235 | Tragic 97.6% |
| Immigrants | Western Asia | 2.1 /100 | #236 | Tragic 97.6% |
| U.S. Virgin Islanders | 1.9 /100 | #237 | Tragic 97.6% |
| Nigerians | 1.8 /100 | #238 | Tragic 97.6% |
| Immigrants | Eastern Asia | 1.6 /100 | #239 | Tragic 97.6% |
| Koreans | 1.5 /100 | #240 | Tragic 97.6% |
| Liberians | 1.4 /100 | #241 | Tragic 97.6% |
| Immigrants | Indonesia | 1.2 /100 | #242 | Tragic 97.6% |