Navajo vs Immigrants 3rd Grade
COMPARE
Navajo
Immigrants
3rd Grade
3rd Grade Comparison
Navajo
Immigrants
97.8%
3RD GRADE
50.0/ 100
METRIC RATING
174th/ 347
METRIC RANK
96.9%
3RD GRADE
0.0/ 100
METRIC RATING
296th/ 347
METRIC RANK
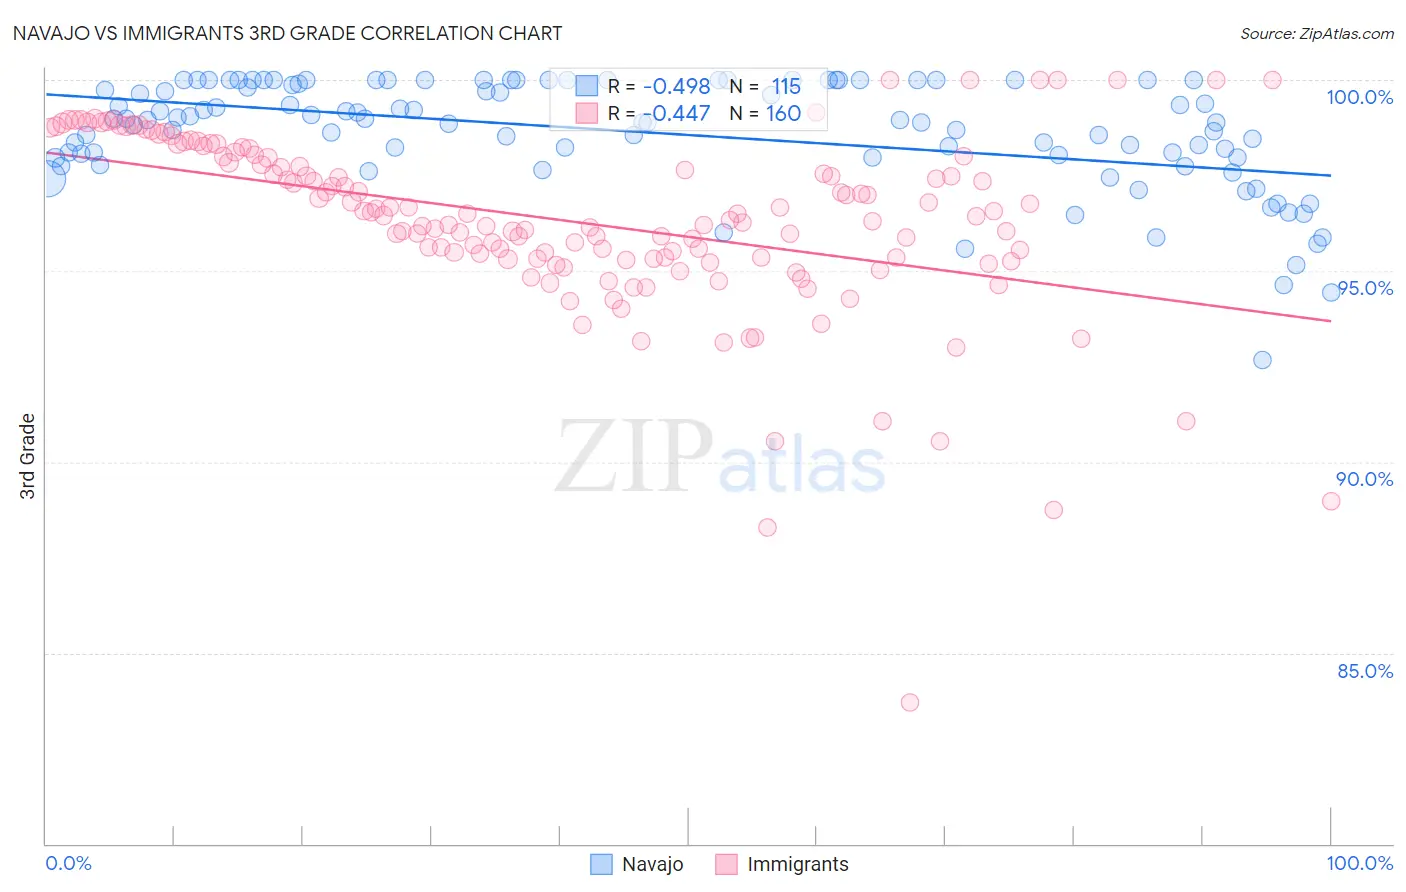
Navajo vs Immigrants 3rd Grade Correlation Chart
The statistical analysis conducted on geographies consisting of 224,872,493 people shows a moderate negative correlation between the proportion of Navajo and percentage of population with at least 3rd grade education in the United States with a correlation coefficient (R) of -0.498 and weighted average of 97.8%. Similarly, the statistical analysis conducted on geographies consisting of 577,788,049 people shows a moderate negative correlation between the proportion of Immigrants and percentage of population with at least 3rd grade education in the United States with a correlation coefficient (R) of -0.447 and weighted average of 96.9%, a difference of 0.91%.
3rd Grade Correlation Summary
| Measurement | Navajo | Immigrants |
| Minimum | 92.7% | 83.7% |
| Maximum | 100.0% | 100.0% |
| Range | 7.3% | 16.3% |
| Mean | 98.6% | 96.3% |
| Median | 98.9% | 96.4% |
| Interquartile 25% (IQ1) | 98.0% | 95.3% |
| Interquartile 75% (IQ3) | 100.0% | 98.0% |
| Interquartile Range (IQR) | 2.0% | 2.7% |
| Standard Deviation (Sample) | 1.4% | 2.4% |
| Standard Deviation (Population) | 1.4% | 2.4% |
Similar Demographics by 3rd Grade
Demographics Similar to Navajo by 3rd Grade
In terms of 3rd grade, the demographic groups most similar to Navajo are Immigrants from Korea (97.8%, a difference of 0.0%), Immigrants from Spain (97.8%, a difference of 0.010%), Comanche (97.8%, a difference of 0.010%), Brazilian (97.8%, a difference of 0.010%), and Kenyan (97.8%, a difference of 0.010%).
| Demographics | Rating | Rank | 3rd Grade |
| Chileans | 55.3 /100 | #167 | Average 97.8% |
| Immigrants | Spain | 54.3 /100 | #168 | Average 97.8% |
| Comanche | 53.8 /100 | #169 | Average 97.8% |
| Brazilians | 53.7 /100 | #170 | Average 97.8% |
| Kenyans | 51.8 /100 | #171 | Average 97.8% |
| Spanish Americans | 51.8 /100 | #172 | Average 97.8% |
| Immigrants | Korea | 50.9 /100 | #173 | Average 97.8% |
| Navajo | 50.0 /100 | #174 | Average 97.8% |
| Immigrants | Micronesia | 47.6 /100 | #175 | Average 97.8% |
| Immigrants | Poland | 47.1 /100 | #176 | Average 97.8% |
| Egyptians | 46.6 /100 | #177 | Average 97.7% |
| Immigrants | Brazil | 46.4 /100 | #178 | Average 97.7% |
| Immigrants | Belarus | 45.9 /100 | #179 | Average 97.7% |
| Immigrants | Sri Lanka | 45.1 /100 | #180 | Average 97.7% |
| Immigrants | Venezuela | 44.4 /100 | #181 | Average 97.7% |
Demographics Similar to Immigrants by 3rd Grade
In terms of 3rd grade, the demographic groups most similar to Immigrants are Haitian (96.9%, a difference of 0.020%), Immigrants from Dominica (96.9%, a difference of 0.030%), Somali (96.8%, a difference of 0.040%), Immigrants from South Eastern Asia (96.8%, a difference of 0.050%), and Immigrants from Cuba (96.8%, a difference of 0.050%).
| Demographics | Rating | Rank | 3rd Grade |
| Immigrants | Thailand | 0.0 /100 | #289 | Tragic 97.1% |
| Immigrants | Portugal | 0.0 /100 | #290 | Tragic 97.0% |
| Immigrants | Afghanistan | 0.0 /100 | #291 | Tragic 97.0% |
| British West Indians | 0.0 /100 | #292 | Tragic 97.0% |
| Immigrants | Grenada | 0.0 /100 | #293 | Tragic 97.0% |
| Malaysians | 0.0 /100 | #294 | Tragic 97.0% |
| Immigrants | Eritrea | 0.0 /100 | #295 | Tragic 97.0% |
| Immigrants | Immigrants | 0.0 /100 | #296 | Tragic 96.9% |
| Haitians | 0.0 /100 | #297 | Tragic 96.9% |
| Immigrants | Dominica | 0.0 /100 | #298 | Tragic 96.9% |
| Somalis | 0.0 /100 | #299 | Tragic 96.8% |
| Immigrants | South Eastern Asia | 0.0 /100 | #300 | Tragic 96.8% |
| Immigrants | Cuba | 0.0 /100 | #301 | Tragic 96.8% |
| Immigrants | Somalia | 0.0 /100 | #302 | Tragic 96.8% |
| Ecuadorians | 0.0 /100 | #303 | Tragic 96.7% |