Liberian vs Hawaiian 7th Grade
COMPARE
Liberian
Hawaiian
7th Grade
7th Grade Comparison
Liberians
Hawaiians
95.9%
7TH GRADE
32.5/ 100
METRIC RATING
191st/ 347
METRIC RANK
95.8%
7TH GRADE
16.0/ 100
METRIC RATING
210th/ 347
METRIC RANK
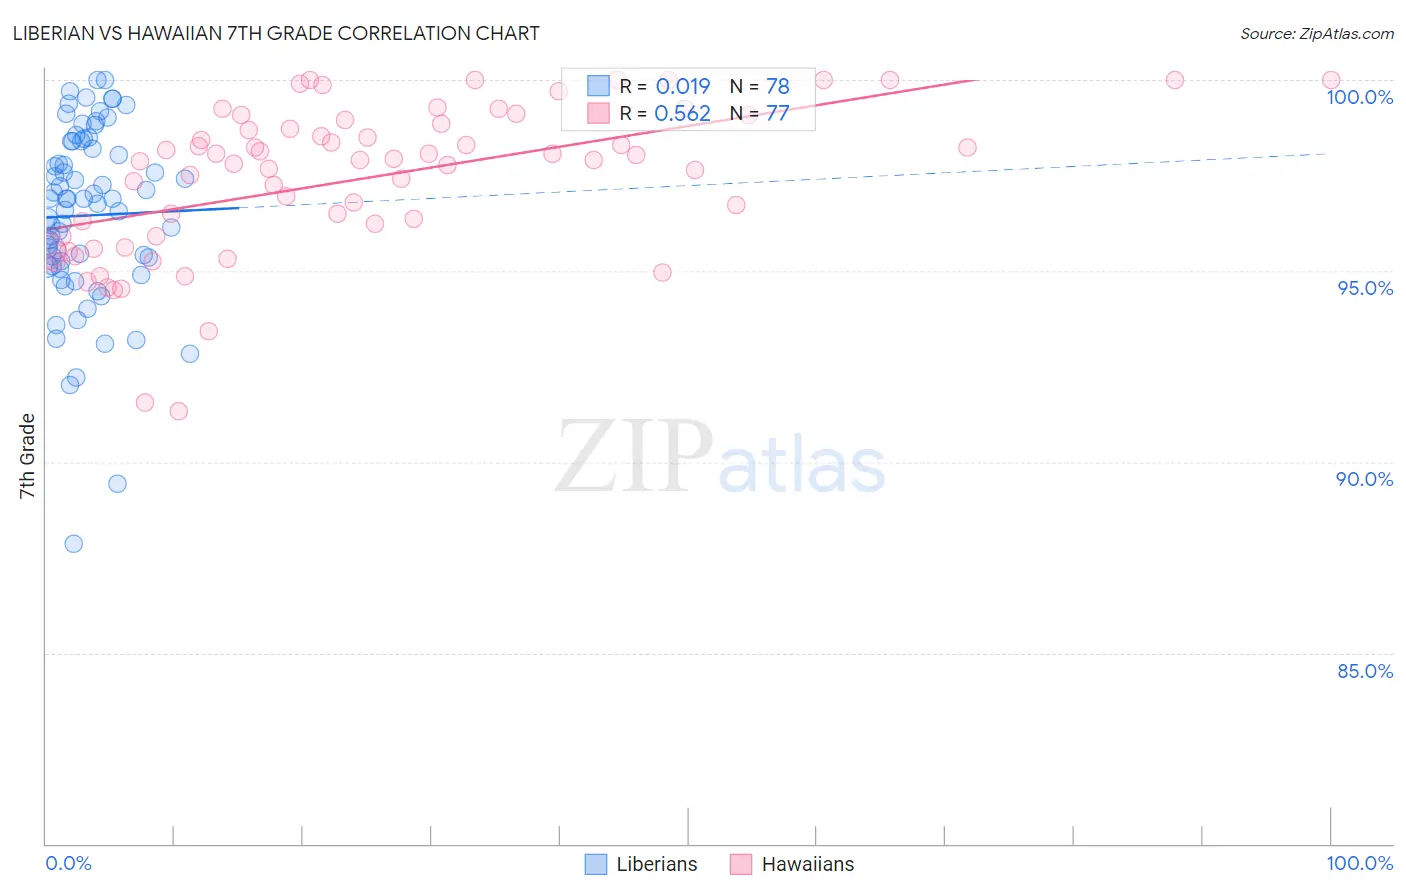
Liberian vs Hawaiian 7th Grade Correlation Chart
The statistical analysis conducted on geographies consisting of 118,089,001 people shows no correlation between the proportion of Liberians and percentage of population with at least 7th grade education in the United States with a correlation coefficient (R) of 0.019 and weighted average of 95.9%. Similarly, the statistical analysis conducted on geographies consisting of 327,621,279 people shows a substantial positive correlation between the proportion of Hawaiians and percentage of population with at least 7th grade education in the United States with a correlation coefficient (R) of 0.562 and weighted average of 95.8%, a difference of 0.14%.
7th Grade Correlation Summary
| Measurement | Liberian | Hawaiian |
| Minimum | 87.9% | 91.3% |
| Maximum | 100.0% | 100.0% |
| Range | 12.1% | 8.7% |
| Mean | 96.5% | 97.4% |
| Median | 96.9% | 97.9% |
| Interquartile 25% (IQ1) | 95.1% | 95.9% |
| Interquartile 75% (IQ3) | 98.4% | 98.9% |
| Interquartile Range (IQR) | 3.3% | 3.0% |
| Standard Deviation (Sample) | 2.4% | 2.0% |
| Standard Deviation (Population) | 2.3% | 2.0% |
Demographics Similar to Liberians and Hawaiians by 7th Grade
In terms of 7th grade, the demographic groups most similar to Liberians are Immigrants from Micronesia (95.9%, a difference of 0.0%), Panamanian (95.9%, a difference of 0.0%), Immigrants from Bahamas (95.9%, a difference of 0.010%), Immigrants from Nepal (95.9%, a difference of 0.020%), and Sudanese (95.9%, a difference of 0.030%). Similarly, the demographic groups most similar to Hawaiians are Dutch West Indian (95.8%, a difference of 0.0%), Navajo (95.8%, a difference of 0.010%), Immigrants from Sudan (95.8%, a difference of 0.010%), African (95.8%, a difference of 0.020%), and Moroccan (95.8%, a difference of 0.030%).
| Demographics | Rating | Rank | 7th Grade |
| Immigrants | Micronesia | 32.6 /100 | #190 | Fair 95.9% |
| Liberians | 32.5 /100 | #191 | Fair 95.9% |
| Panamanians | 32.3 /100 | #192 | Fair 95.9% |
| Immigrants | Bahamas | 30.8 /100 | #193 | Fair 95.9% |
| Immigrants | Nepal | 30.0 /100 | #194 | Fair 95.9% |
| Sudanese | 28.1 /100 | #195 | Fair 95.9% |
| Apache | 27.6 /100 | #196 | Fair 95.9% |
| Immigrants | Zaire | 26.7 /100 | #197 | Fair 95.9% |
| Paraguayans | 24.8 /100 | #198 | Fair 95.9% |
| Guamanians/Chamorros | 23.5 /100 | #199 | Fair 95.9% |
| Argentineans | 23.2 /100 | #200 | Fair 95.9% |
| Immigrants | Argentina | 21.9 /100 | #201 | Fair 95.9% |
| Immigrants | Northern Africa | 21.4 /100 | #202 | Fair 95.8% |
| Comanche | 21.1 /100 | #203 | Fair 95.8% |
| Assyrians/Chaldeans/Syriacs | 20.5 /100 | #204 | Fair 95.8% |
| Moroccans | 18.9 /100 | #205 | Poor 95.8% |
| Africans | 17.6 /100 | #206 | Poor 95.8% |
| Navajo | 17.0 /100 | #207 | Poor 95.8% |
| Immigrants | Sudan | 17.0 /100 | #208 | Poor 95.8% |
| Dutch West Indians | 16.1 /100 | #209 | Poor 95.8% |
| Hawaiians | 16.0 /100 | #210 | Poor 95.8% |