Immigrants from Eastern Africa vs Immigrants from Ireland 1st Grade

COMPARE

Immigrants from Eastern Africa
Race
Ancestry
AfghanAfricanAlaska NativeAlaskan AthabascanAlbanianAleutAlsatianAmericanApacheArabArapahoArgentineanArmenianAssyrian/Chaldean/SyriacAustralianAustrianBahamianBangladeshiBarbadianBasqueBelgianBelizeanBermudanBhutaneseBlackfeetBolivianBrazilianBritishBritish West IndianBulgarianBurmeseCajunCambodianCanadianCape VerdeanCarpatho RusynCelticCentral AmericanCentral American IndianCherokeeCheyenneChickasawChileanChineseChippewaChoctawColombianColvilleComancheCosta RicanCreeCreekCroatianCrowCubanCypriotCzechCzechoslovakianDanishDelawareDominicanDutchDutch West IndianEastern EuropeanEcuadorianEgyptianEnglishEstonianEthiopianEuropeanFijianFilipinoFinnishFrenchFrench American IndianFrench CanadianGermanGerman RussianGhanaianGreekGuamanian/ChamorroGuatemalanGuyaneseHaitianHmongHonduranHopiHoumaHungarianIcelanderIndian (Asian)IndonesianInupiatIranianIraqiIrishIroquoisIsraeliItalianJamaicanJapaneseJordanianKenyanKiowaKoreanLaotianLatvianLebaneseLiberianLithuanianLumbeeLuxembourgerMacedonianMalaysianMalteseMarshalleseMenomineeMexicanMexican American IndianMongolianMoroccanNative HawaiianNavajoNepaleseNew ZealanderNicaraguanNigerianNorthern EuropeanNorwegianOkinawanOsageOttawaPaiutePakistaniPalestinianPanamanianParaguayanPennsylvania GermanPeruvianPimaPolishPortuguesePotawatomiPuebloPuerto RicanPuget Sound SalishRomanianRussianSalvadoranSamoanScandinavianScotch-IrishScottishSeminoleSenegaleseSerbianShoshoneSierra LeoneanSiouxSlavicSlovakSloveneSomaliSouth AfricanSouth AmericanSouth American IndianSoviet UnionSpaniardSpanishSpanish AmericanSpanish American IndianSri LankanSubsaharan AfricanSudaneseSwedishSwissSyrianTaiwaneseThaiTlingit-HaidaTohono O'OdhamTonganTrinidadian and TobagonianTsimshianTurkishU.S. Virgin IslanderUgandanUkrainianUruguayanUteVenezuelanVietnameseWelshWest IndianYakamaYaquiYugoslavianYumanYup'ikZimbabwean
Immigration
NonimmigrantsImmigrantsAfghanistanAfricaAlbaniaArgentinaArmeniaAsiaAustraliaAustriaBahamasBangladeshBarbadosBelarusBelgiumBelizeBoliviaBosnia and HerzegovinaBrazilBulgariaBurma/MyanmarCabo VerdeCambodiaCameroonCanadaCaribbeanCentral AmericaChileChinaColombiaCongoCosta RicaCroatiaCubaCzechoslovakiaDenmarkDominicaDominican RepublicEastern AfricaEastern AsiaEastern EuropeEcuadorEgyptEl SalvadorEnglandEritreaEthiopiaEuropeFijiFranceGermanyGhanaGreeceGrenadaGuatemalaGuyanaHaitiHondurasHong KongHungaryIndiaIndonesiaIranIraqIsraelItalyJamaicaJapanJordanKazakhstanKenyaKoreaKuwaitLaosLatin AmericaLatviaLebanonLiberiaLithuaniaMalaysiaMexicoMicronesiaMiddle AfricaMoldovaMoroccoNepalNetherlandsNicaraguaNigeriaNorth AmericaNorth MacedoniaNorthern AfricaNorthern EuropeNorwayOceaniaPakistanPanamaPeruPhilippinesPolandPortugalRomaniaRussiaSaudi ArabiaScotlandSenegalSerbiaSierra LeoneSingaporeSomaliaSouth AfricaSouth AmericaSouth Central AsiaSouth Eastern AsiaSouthern EuropeSpainSri LankaSt. Vincent and the GrenadinesSudanSwedenSwitzerlandSyriaTaiwanThailandTrinidad and TobagoTurkeyUgandaUkraineUruguayUzbekistanVenezuelaVietnamWest IndiesWestern AfricaWestern AsiaWestern EuropeYemenZaireZimbabweAzores
Immigrants from Ireland
Race
Ancestry
AfghanAfricanAlaska NativeAlaskan AthabascanAlbanianAleutAlsatianAmericanApacheArabArapahoArgentineanArmenianAssyrian/Chaldean/SyriacAustralianAustrianBahamianBangladeshiBarbadianBasqueBelgianBelizeanBermudanBhutaneseBlackfeetBolivianBrazilianBritishBritish West IndianBulgarianBurmeseCajunCambodianCanadianCape VerdeanCarpatho RusynCelticCentral AmericanCentral American IndianCherokeeCheyenneChickasawChileanChineseChippewaChoctawColombianColvilleComancheCosta RicanCreeCreekCroatianCrowCubanCypriotCzechCzechoslovakianDanishDelawareDominicanDutchDutch West IndianEastern EuropeanEcuadorianEgyptianEnglishEstonianEthiopianEuropeanFijianFilipinoFinnishFrenchFrench American IndianFrench CanadianGermanGerman RussianGhanaianGreekGuamanian/ChamorroGuatemalanGuyaneseHaitianHmongHonduranHopiHoumaHungarianIcelanderIndian (Asian)IndonesianInupiatIranianIraqiIrishIroquoisIsraeliItalianJamaicanJapaneseJordanianKenyanKiowaKoreanLaotianLatvianLebaneseLiberianLithuanianLumbeeLuxembourgerMacedonianMalaysianMalteseMarshalleseMenomineeMexicanMexican American IndianMongolianMoroccanNative HawaiianNavajoNepaleseNew ZealanderNicaraguanNigerianNorthern EuropeanNorwegianOkinawanOsageOttawaPaiutePakistaniPalestinianPanamanianParaguayanPennsylvania GermanPeruvianPimaPolishPortuguesePotawatomiPuebloPuerto RicanPuget Sound SalishRomanianRussianSalvadoranSamoanScandinavianScotch-IrishScottishSeminoleSenegaleseSerbianShoshoneSierra LeoneanSiouxSlavicSlovakSloveneSomaliSouth AfricanSouth AmericanSouth American IndianSoviet UnionSpaniardSpanishSpanish AmericanSpanish American IndianSri LankanSubsaharan AfricanSudaneseSwedishSwissSyrianTaiwaneseThaiTlingit-HaidaTohono O'OdhamTonganTrinidadian and TobagonianTsimshianTurkishU.S. Virgin IslanderUgandanUkrainianUruguayanUteVenezuelanVietnameseWelshWest IndianYakamaYaquiYugoslavianYumanYup'ikZimbabwean
Immigration
NonimmigrantsImmigrantsAfghanistanAfricaAlbaniaArgentinaArmeniaAsiaAustraliaAustriaBahamasBangladeshBarbadosBelarusBelgiumBelizeBoliviaBosnia and HerzegovinaBrazilBulgariaBurma/MyanmarCabo VerdeCambodiaCameroonCanadaCaribbeanCentral AmericaChileChinaColombiaCongoCosta RicaCroatiaCubaCzechoslovakiaDenmarkDominicaDominican RepublicEastern AsiaEastern EuropeEcuadorEgyptEl SalvadorEnglandEritreaEthiopiaEuropeFijiFranceGermanyGhanaGreeceGrenadaGuatemalaGuyanaHaitiHondurasHong KongHungaryIndiaIndonesiaIranIraqIrelandIsraelItalyJamaicaJapanJordanKazakhstanKenyaKoreaKuwaitLaosLatin AmericaLatviaLebanonLiberiaLithuaniaMalaysiaMexicoMicronesiaMiddle AfricaMoldovaMoroccoNepalNetherlandsNicaraguaNigeriaNorth AmericaNorth MacedoniaNorthern AfricaNorthern EuropeNorwayOceaniaPakistanPanamaPeruPhilippinesPolandPortugalRomaniaRussiaSaudi ArabiaScotlandSenegalSerbiaSierra LeoneSingaporeSomaliaSouth AfricaSouth AmericaSouth Central AsiaSouth Eastern AsiaSouthern EuropeSpainSri LankaSt. Vincent and the GrenadinesSudanSwedenSwitzerlandSyriaTaiwanThailandTrinidad and TobagoTurkeyUgandaUkraineUruguayUzbekistanVenezuelaVietnamWest IndiesWestern AfricaWestern AsiaWestern EuropeYemenZaireZimbabweAzores
1st Grade
Income
Poverty
Unemployment
Labor Participation
Family Structure
Vehicle Availability
Education Level
Disability

1st Grade Comparison

Immigrants from Eastern Africa

Immigrants from Ireland

Tragic
Exceptional
97.6%
1ST GRADE
1.0/ 100
METRIC RATING
246th/ 347
METRIC RANK
98.2%
1ST GRADE
97.7/ 100
METRIC RATING
103rd/ 347
METRIC RANK

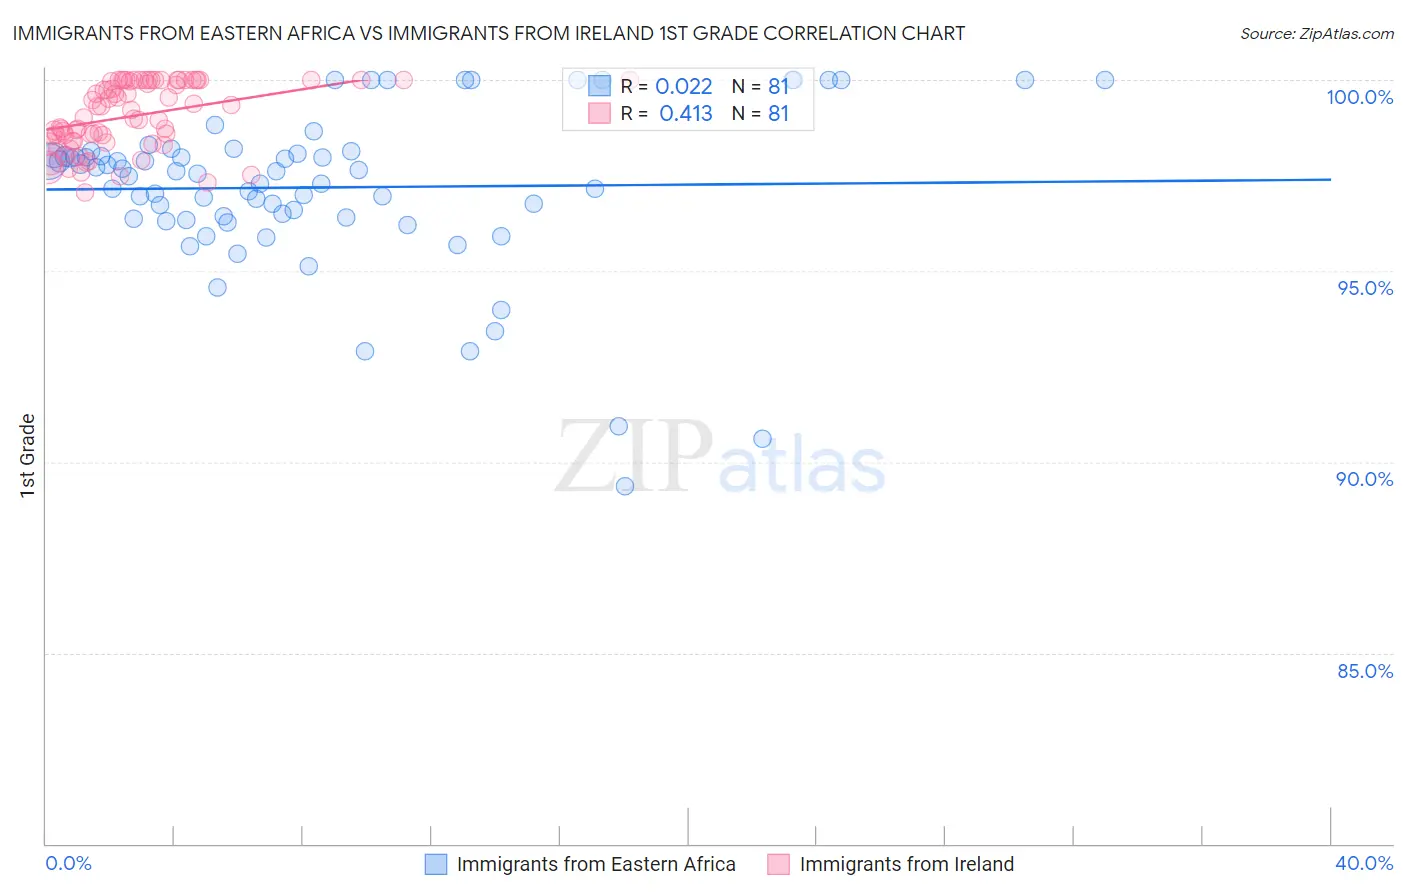
Immigrants from Eastern Africa vs Immigrants from Ireland 1st Grade Correlation Chart

The statistical analysis conducted on geographies consisting of 355,144,184 people shows no correlation between the proportion of Immigrants from Eastern Africa and percentage of population with at least 1st grade education in the United States with a correlation coefficient (R) of 0.022 and weighted average of 97.6%. Similarly, the statistical analysis conducted on geographies consisting of 240,784,498 people shows a moderate positive correlation between the proportion of Immigrants from Ireland and percentage of population with at least 1st grade education in the United States with a correlation coefficient (R) of 0.413 and weighted average of 98.2%, a difference of 0.65%.
Immigrants from Eastern Africa vs Immigrants from Ireland 1st Grade

1st Grade Correlation Summary

MeasurementImmigrants from Eastern AfricaImmigrants from Ireland
Minimum89.4%97.1%
Maximum100.0%100.0%
Range10.6%2.9%
Mean97.2%99.1%
Median97.6%99.2%
Interquartile 25% (IQ1)96.4%98.4%
Interquartile 75% (IQ3)98.1%100.0%
Interquartile Range (IQR)1.7%1.6%
Standard Deviation (Sample)2.1%0.86%
Standard Deviation (Population)2.1%0.85%

Similar Demographics by 1st Grade

Demographics Similar to Immigrants from Eastern Africa by 1st Grade

In terms of 1st grade, the demographic groups most similar to Immigrants from Eastern Africa are Asian (97.6%, a difference of 0.0%), South American (97.6%, a difference of 0.0%), Peruvian (97.6%, a difference of 0.0%), Immigrants from Middle Africa (97.6%, a difference of 0.0%), and Immigrants from Senegal (97.6%, a difference of 0.0%).
DemographicsRating | Rank1st Grade
Immigrants | Eastern Asia
1.6
/100
|
#239
Tragic
97.6%
Koreans
1.5
/100
|
#240
Tragic
97.6%
Liberians
1.4
/100
|
#241
Tragic
97.6%
Immigrants | Indonesia
1.2
/100
|
#242
Tragic
97.6%
Bolivians
1.2
/100
|
#243
Tragic
97.6%
Asians
1.1
/100
|
#244
Tragic
97.6%
South Americans
1.1
/100
|
#245
Tragic
97.6%
Immigrants | Eastern Africa
1.0
/100
|
#246
Tragic
97.6%
Peruvians
1.0
/100
|
#247
Tragic
97.6%
Immigrants | Middle Africa
1.0
/100
|
#248
Tragic
97.6%
Immigrants | Senegal
1.0
/100
|
#249
Tragic
97.6%
Ethiopians
0.9
/100
|
#250
Tragic
97.6%
Immigrants | Iraq
0.9
/100
|
#251
Tragic
97.6%
Immigrants | Africa
0.9
/100
|
#252
Tragic
97.6%
Immigrants | Congo
0.7
/100
|
#253
Tragic
97.5%

Demographics Similar to Immigrants from Ireland by 1st Grade

In terms of 1st grade, the demographic groups most similar to Immigrants from Ireland are Romanian (98.2%, a difference of 0.0%), Cree (98.2%, a difference of 0.0%), Colville (98.2%, a difference of 0.010%), Pima (98.2%, a difference of 0.010%), and Basque (98.2%, a difference of 0.010%).
DemographicsRating | Rank1st Grade
Cypriots
98.3
/100
|
#96
Exceptional
98.2%
Immigrants | Nonimmigrants
98.3
/100
|
#97
Exceptional
98.2%
Choctaw
98.3
/100
|
#98
Exceptional
98.2%
Puget Sound Salish
98.2
/100
|
#99
Exceptional
98.2%
Colville
98.0
/100
|
#100
Exceptional
98.2%
Romanians
97.8
/100
|
#101
Exceptional
98.2%
Cree
97.8
/100
|
#102
Exceptional
98.2%
Immigrants | Ireland
97.7
/100
|
#103
Exceptional
98.2%
Pima
97.5
/100
|
#104
Exceptional
98.2%
Basques
97.4
/100
|
#105
Exceptional
98.2%
Turks
97.4
/100
|
#106
Exceptional
98.2%
Immigrants | Switzerland
97.3
/100
|
#107
Exceptional
98.2%
Bhutanese
97.3
/100
|
#108
Exceptional
98.2%
German Russians
97.1
/100
|
#109
Exceptional
98.2%
Immigrants | Singapore
96.7
/100
|
#110
Exceptional
98.2%