Immigrants from Dominican Republic vs Immigrants from Saudi Arabia Disability Age 18 to 34
COMPARE
Immigrants from Dominican Republic
Immigrants from Saudi Arabia
Disability Age 18 to 34
Disability Age 18 to 34 Comparison
Immigrants from Dominican Republic
Immigrants from Saudi Arabia
6.4%
DISABILITY AGE 18 TO 34
82.7/ 100
METRIC RATING
150th/ 347
METRIC RANK
6.3%
DISABILITY AGE 18 TO 34
90.4/ 100
METRIC RATING
131st/ 347
METRIC RANK
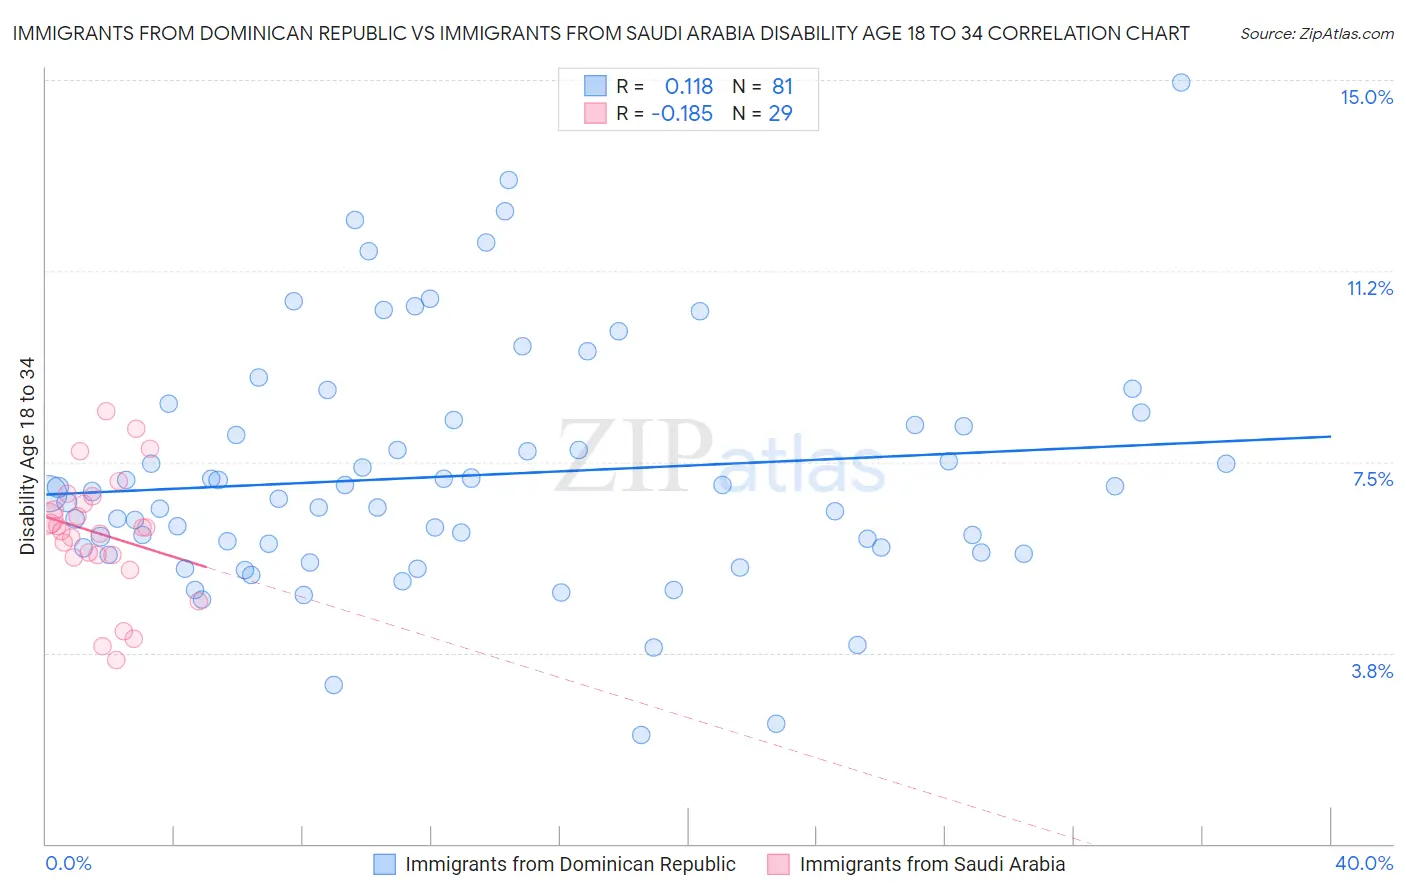
Immigrants from Dominican Republic vs Immigrants from Saudi Arabia Disability Age 18 to 34 Correlation Chart
The statistical analysis conducted on geographies consisting of 274,679,116 people shows a poor positive correlation between the proportion of Immigrants from Dominican Republic and percentage of population with a disability between the ages 18 and 35 in the United States with a correlation coefficient (R) of 0.118 and weighted average of 6.4%. Similarly, the statistical analysis conducted on geographies consisting of 164,269,586 people shows a poor negative correlation between the proportion of Immigrants from Saudi Arabia and percentage of population with a disability between the ages 18 and 35 in the United States with a correlation coefficient (R) of -0.185 and weighted average of 6.3%, a difference of 1.2%.
Disability Age 18 to 34 Correlation Summary
| Measurement | Immigrants from Dominican Republic | Immigrants from Saudi Arabia |
| Minimum | 2.1% | 3.6% |
| Maximum | 14.9% | 8.5% |
| Range | 12.8% | 4.9% |
| Mean | 7.2% | 6.1% |
| Median | 6.9% | 6.2% |
| Interquartile 25% (IQ1) | 5.8% | 5.6% |
| Interquartile 75% (IQ3) | 8.3% | 6.8% |
| Interquartile Range (IQR) | 2.5% | 1.1% |
| Standard Deviation (Sample) | 2.4% | 1.2% |
| Standard Deviation (Population) | 2.4% | 1.2% |
Demographics Similar to Immigrants from Dominican Republic and Immigrants from Saudi Arabia by Disability Age 18 to 34
In terms of disability age 18 to 34, the demographic groups most similar to Immigrants from Dominican Republic are Honduran (6.4%, a difference of 0.040%), Immigrants from Belgium (6.4%, a difference of 0.10%), Immigrants from South Africa (6.4%, a difference of 0.12%), Belizean (6.4%, a difference of 0.28%), and Moroccan (6.4%, a difference of 0.33%). Similarly, the demographic groups most similar to Immigrants from Saudi Arabia are Immigrants from Dominica (6.3%, a difference of 0.010%), Guatemalan (6.4%, a difference of 0.16%), Brazilian (6.4%, a difference of 0.28%), Immigrants from Europe (6.4%, a difference of 0.32%), and Palestinian (6.4%, a difference of 0.36%).
| Demographics | Rating | Rank | Disability Age 18 to 34 |
| Immigrants | Dominica | 90.5 /100 | #130 | Exceptional 6.3% |
| Immigrants | Saudi Arabia | 90.4 /100 | #131 | Exceptional 6.3% |
| Guatemalans | 89.6 /100 | #132 | Excellent 6.4% |
| Brazilians | 89.0 /100 | #133 | Excellent 6.4% |
| Immigrants | Europe | 88.8 /100 | #134 | Excellent 6.4% |
| Palestinians | 88.5 /100 | #135 | Excellent 6.4% |
| Immigrants | Sweden | 88.5 /100 | #136 | Excellent 6.4% |
| Immigrants | Honduras | 87.7 /100 | #137 | Excellent 6.4% |
| Spanish American Indians | 87.7 /100 | #138 | Excellent 6.4% |
| Immigrants | Belize | 87.4 /100 | #139 | Excellent 6.4% |
| Immigrants | Fiji | 87.3 /100 | #140 | Excellent 6.4% |
| Jamaicans | 86.8 /100 | #141 | Excellent 6.4% |
| South American Indians | 86.5 /100 | #142 | Excellent 6.4% |
| Immigrants | Latvia | 86.4 /100 | #143 | Excellent 6.4% |
| Albanians | 85.3 /100 | #144 | Excellent 6.4% |
| Moroccans | 85.2 /100 | #145 | Excellent 6.4% |
| Belizeans | 84.9 /100 | #146 | Excellent 6.4% |
| Immigrants | South Africa | 83.7 /100 | #147 | Excellent 6.4% |
| Immigrants | Belgium | 83.5 /100 | #148 | Excellent 6.4% |
| Hondurans | 83.1 /100 | #149 | Excellent 6.4% |
| Immigrants | Dominican Republic | 82.7 /100 | #150 | Excellent 6.4% |