Immigrants from Dominican Republic vs Immigrants from North Macedonia 6th Grade
COMPARE
Immigrants from Dominican Republic
Immigrants from North Macedonia
6th Grade
6th Grade Comparison
Immigrants from Dominican Republic
Immigrants from North Macedonia
94.6%
6TH GRADE
0.0/ 100
METRIC RATING
336th/ 347
METRIC RANK
97.2%
6TH GRADE
85.5/ 100
METRIC RATING
140th/ 347
METRIC RANK
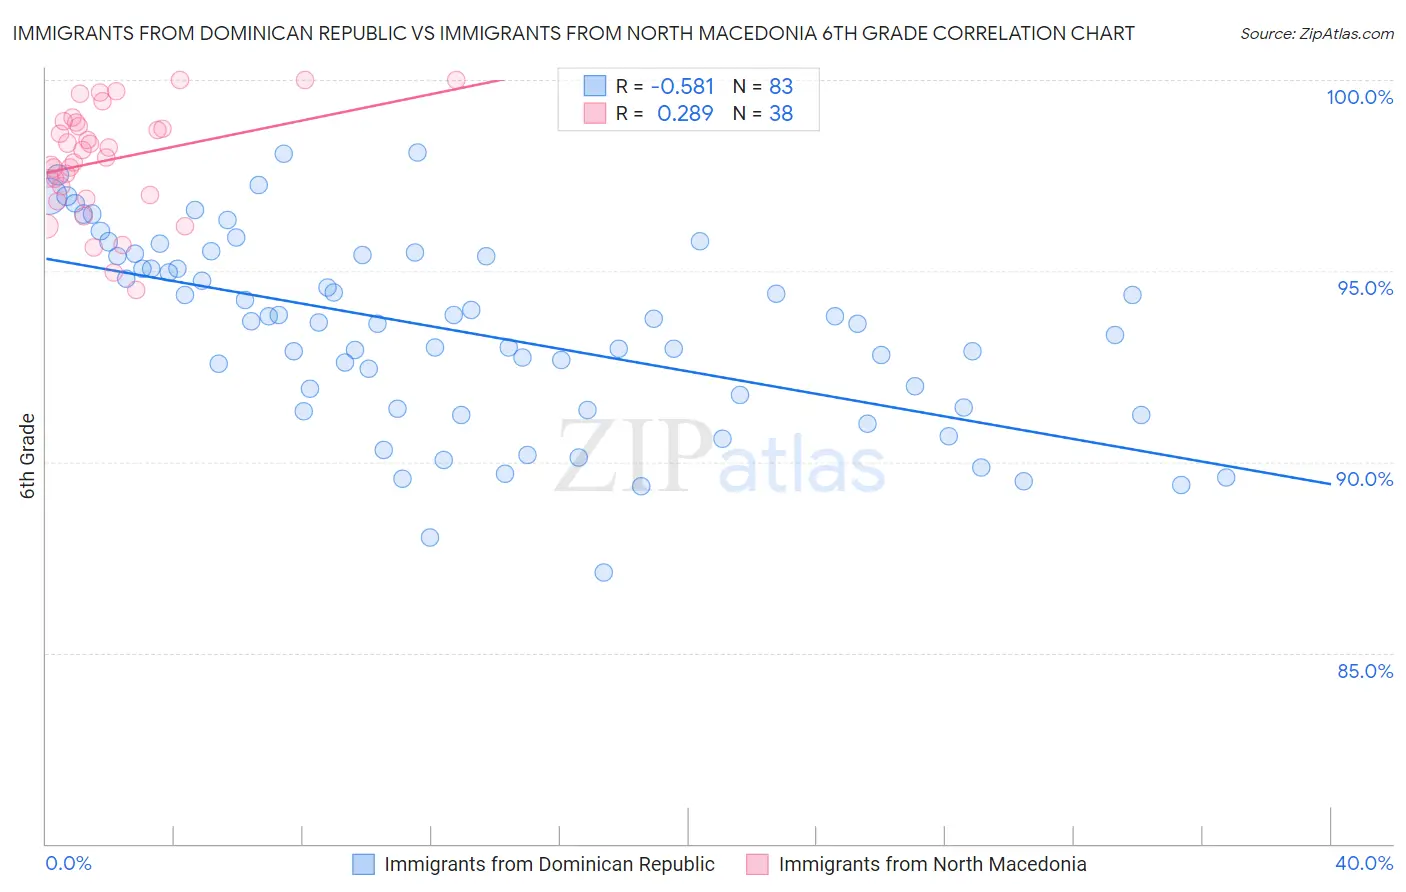
Immigrants from Dominican Republic vs Immigrants from North Macedonia 6th Grade Correlation Chart
The statistical analysis conducted on geographies consisting of 275,144,349 people shows a substantial negative correlation between the proportion of Immigrants from Dominican Republic and percentage of population with at least 6th grade education in the United States with a correlation coefficient (R) of -0.581 and weighted average of 94.6%. Similarly, the statistical analysis conducted on geographies consisting of 74,317,186 people shows a weak positive correlation between the proportion of Immigrants from North Macedonia and percentage of population with at least 6th grade education in the United States with a correlation coefficient (R) of 0.289 and weighted average of 97.2%, a difference of 2.8%.
6th Grade Correlation Summary
| Measurement | Immigrants from Dominican Republic | Immigrants from North Macedonia |
| Minimum | 87.1% | 94.5% |
| Maximum | 98.1% | 100.0% |
| Range | 11.0% | 5.5% |
| Mean | 93.4% | 97.9% |
| Median | 93.6% | 98.1% |
| Interquartile 25% (IQ1) | 91.4% | 97.0% |
| Interquartile 75% (IQ3) | 95.4% | 98.9% |
| Interquartile Range (IQR) | 4.0% | 1.9% |
| Standard Deviation (Sample) | 2.5% | 1.4% |
| Standard Deviation (Population) | 2.5% | 1.4% |
Similar Demographics by 6th Grade
Demographics Similar to Immigrants from Dominican Republic by 6th Grade
In terms of 6th grade, the demographic groups most similar to Immigrants from Dominican Republic are Mexican (94.6%, a difference of 0.020%), Immigrants from the Azores (94.7%, a difference of 0.040%), Immigrants from Latin America (94.7%, a difference of 0.060%), Immigrants from Honduras (94.8%, a difference of 0.14%), and Central American (94.5%, a difference of 0.18%).
| Demographics | Rating | Rank | 6th Grade |
| Dominicans | 0.0 /100 | #329 | Tragic 94.9% |
| Nepalese | 0.0 /100 | #330 | Tragic 94.9% |
| Immigrants | Armenia | 0.0 /100 | #331 | Tragic 94.9% |
| Immigrants | Honduras | 0.0 /100 | #332 | Tragic 94.8% |
| Immigrants | Latin America | 0.0 /100 | #333 | Tragic 94.7% |
| Immigrants | Azores | 0.0 /100 | #334 | Tragic 94.7% |
| Mexicans | 0.0 /100 | #335 | Tragic 94.6% |
| Immigrants | Dominican Republic | 0.0 /100 | #336 | Tragic 94.6% |
| Central Americans | 0.0 /100 | #337 | Tragic 94.5% |
| Immigrants | Cabo Verde | 0.0 /100 | #338 | Tragic 94.4% |
| Yakama | 0.0 /100 | #339 | Tragic 94.3% |
| Guatemalans | 0.0 /100 | #340 | Tragic 94.2% |
| Immigrants | Yemen | 0.0 /100 | #341 | Tragic 94.1% |
| Immigrants | Central America | 0.0 /100 | #342 | Tragic 94.0% |
| Immigrants | Mexico | 0.0 /100 | #343 | Tragic 93.9% |
Demographics Similar to Immigrants from North Macedonia by 6th Grade
In terms of 6th grade, the demographic groups most similar to Immigrants from North Macedonia are Immigrants from Turkey (97.3%, a difference of 0.010%), Seminole (97.2%, a difference of 0.010%), Jordanian (97.2%, a difference of 0.010%), Burmese (97.3%, a difference of 0.020%), and Blackfeet (97.3%, a difference of 0.020%).
| Demographics | Rating | Rank | 6th Grade |
| Immigrants | Moldova | 90.0 /100 | #133 | Excellent 97.3% |
| Immigrants | Kuwait | 89.5 /100 | #134 | Excellent 97.3% |
| Immigrants | Hungary | 89.5 /100 | #135 | Excellent 97.3% |
| Filipinos | 88.9 /100 | #136 | Excellent 97.3% |
| Burmese | 87.8 /100 | #137 | Excellent 97.3% |
| Blackfeet | 87.7 /100 | #138 | Excellent 97.3% |
| Immigrants | Turkey | 86.1 /100 | #139 | Excellent 97.3% |
| Immigrants | North Macedonia | 85.5 /100 | #140 | Excellent 97.2% |
| Seminole | 84.8 /100 | #141 | Excellent 97.2% |
| Jordanians | 84.6 /100 | #142 | Excellent 97.2% |
| Pima | 82.9 /100 | #143 | Excellent 97.2% |
| Israelis | 82.9 /100 | #144 | Excellent 97.2% |
| Spaniards | 80.1 /100 | #145 | Excellent 97.2% |
| Hopi | 78.8 /100 | #146 | Good 97.2% |
| Immigrants | South Central Asia | 78.1 /100 | #147 | Good 97.2% |