Immigrants from Dominican Republic vs Syrian 6th Grade
COMPARE
Immigrants from Dominican Republic
Syrian
6th Grade
6th Grade Comparison
Immigrants from Dominican Republic
Syrians
94.6%
6TH GRADE
0.0/ 100
METRIC RATING
336th/ 347
METRIC RANK
97.4%
6TH GRADE
94.8/ 100
METRIC RATING
120th/ 347
METRIC RANK
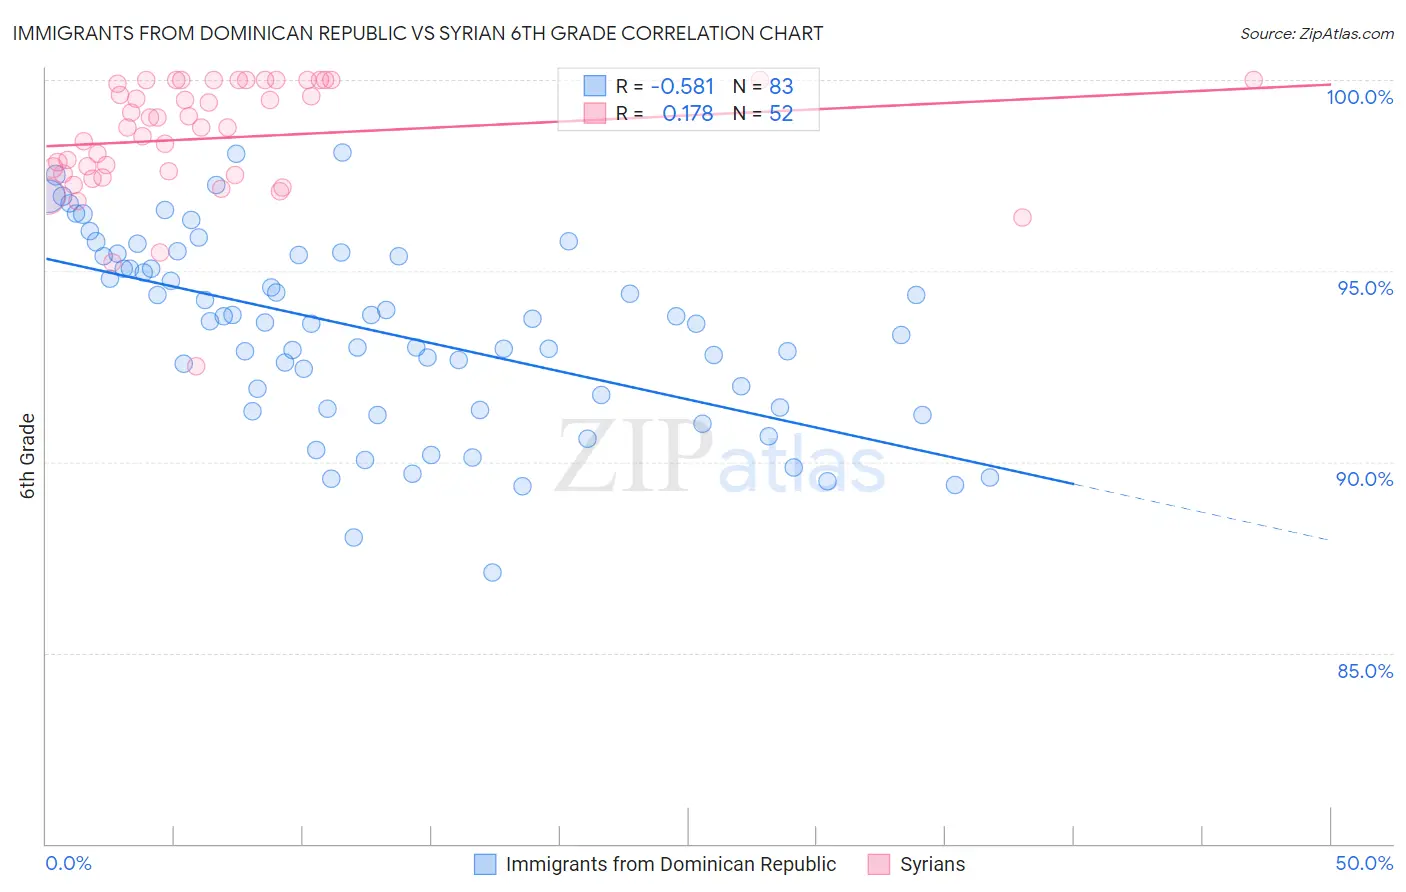
Immigrants from Dominican Republic vs Syrian 6th Grade Correlation Chart
The statistical analysis conducted on geographies consisting of 275,144,349 people shows a substantial negative correlation between the proportion of Immigrants from Dominican Republic and percentage of population with at least 6th grade education in the United States with a correlation coefficient (R) of -0.581 and weighted average of 94.6%. Similarly, the statistical analysis conducted on geographies consisting of 266,305,988 people shows a poor positive correlation between the proportion of Syrians and percentage of population with at least 6th grade education in the United States with a correlation coefficient (R) of 0.178 and weighted average of 97.4%, a difference of 2.9%.
6th Grade Correlation Summary
| Measurement | Immigrants from Dominican Republic | Syrian |
| Minimum | 87.1% | 92.5% |
| Maximum | 98.1% | 100.0% |
| Range | 11.0% | 7.5% |
| Mean | 93.4% | 98.5% |
| Median | 93.6% | 98.8% |
| Interquartile 25% (IQ1) | 91.4% | 97.5% |
| Interquartile 75% (IQ3) | 95.4% | 100.0% |
| Interquartile Range (IQR) | 4.0% | 2.5% |
| Standard Deviation (Sample) | 2.5% | 1.5% |
| Standard Deviation (Population) | 2.5% | 1.5% |
Similar Demographics by 6th Grade
Demographics Similar to Immigrants from Dominican Republic by 6th Grade
In terms of 6th grade, the demographic groups most similar to Immigrants from Dominican Republic are Mexican (94.6%, a difference of 0.020%), Immigrants from the Azores (94.7%, a difference of 0.040%), Immigrants from Latin America (94.7%, a difference of 0.060%), Immigrants from Honduras (94.8%, a difference of 0.14%), and Central American (94.5%, a difference of 0.18%).
| Demographics | Rating | Rank | 6th Grade |
| Dominicans | 0.0 /100 | #329 | Tragic 94.9% |
| Nepalese | 0.0 /100 | #330 | Tragic 94.9% |
| Immigrants | Armenia | 0.0 /100 | #331 | Tragic 94.9% |
| Immigrants | Honduras | 0.0 /100 | #332 | Tragic 94.8% |
| Immigrants | Latin America | 0.0 /100 | #333 | Tragic 94.7% |
| Immigrants | Azores | 0.0 /100 | #334 | Tragic 94.7% |
| Mexicans | 0.0 /100 | #335 | Tragic 94.6% |
| Immigrants | Dominican Republic | 0.0 /100 | #336 | Tragic 94.6% |
| Central Americans | 0.0 /100 | #337 | Tragic 94.5% |
| Immigrants | Cabo Verde | 0.0 /100 | #338 | Tragic 94.4% |
| Yakama | 0.0 /100 | #339 | Tragic 94.3% |
| Guatemalans | 0.0 /100 | #340 | Tragic 94.2% |
| Immigrants | Yemen | 0.0 /100 | #341 | Tragic 94.1% |
| Immigrants | Central America | 0.0 /100 | #342 | Tragic 94.0% |
| Immigrants | Mexico | 0.0 /100 | #343 | Tragic 93.9% |
Demographics Similar to Syrians by 6th Grade
In terms of 6th grade, the demographic groups most similar to Syrians are Immigrants from Zimbabwe (97.4%, a difference of 0.0%), Immigrants from Norway (97.4%, a difference of 0.0%), Basque (97.4%, a difference of 0.010%), Immigrants from Japan (97.4%, a difference of 0.010%), and Immigrants from France (97.4%, a difference of 0.010%).
| Demographics | Rating | Rank | 6th Grade |
| Immigrants | Saudi Arabia | 96.5 /100 | #113 | Exceptional 97.4% |
| Colville | 96.4 /100 | #114 | Exceptional 97.4% |
| Immigrants | Switzerland | 95.7 /100 | #115 | Exceptional 97.4% |
| Lebanese | 95.5 /100 | #116 | Exceptional 97.4% |
| Basques | 95.4 /100 | #117 | Exceptional 97.4% |
| Immigrants | Japan | 95.2 /100 | #118 | Exceptional 97.4% |
| Immigrants | Zimbabwe | 95.0 /100 | #119 | Exceptional 97.4% |
| Syrians | 94.8 /100 | #120 | Exceptional 97.4% |
| Immigrants | Norway | 94.7 /100 | #121 | Exceptional 97.4% |
| Immigrants | France | 94.5 /100 | #122 | Exceptional 97.4% |
| Hmong | 94.4 /100 | #123 | Exceptional 97.4% |
| Okinawans | 94.2 /100 | #124 | Exceptional 97.4% |
| Spanish | 93.7 /100 | #125 | Exceptional 97.3% |
| Immigrants | Bulgaria | 93.6 /100 | #126 | Exceptional 97.3% |
| Immigrants | Croatia | 93.1 /100 | #127 | Exceptional 97.3% |