Argentinean vs Immigrants from Liberia 2nd Grade
COMPARE
Argentinean
Immigrants from Liberia
2nd Grade
2nd Grade Comparison
Argentineans
Immigrants from Liberia
97.9%
2ND GRADE
46.3/ 100
METRIC RATING
178th/ 347
METRIC RANK
97.4%
2ND GRADE
0.4/ 100
METRIC RATING
264th/ 347
METRIC RANK
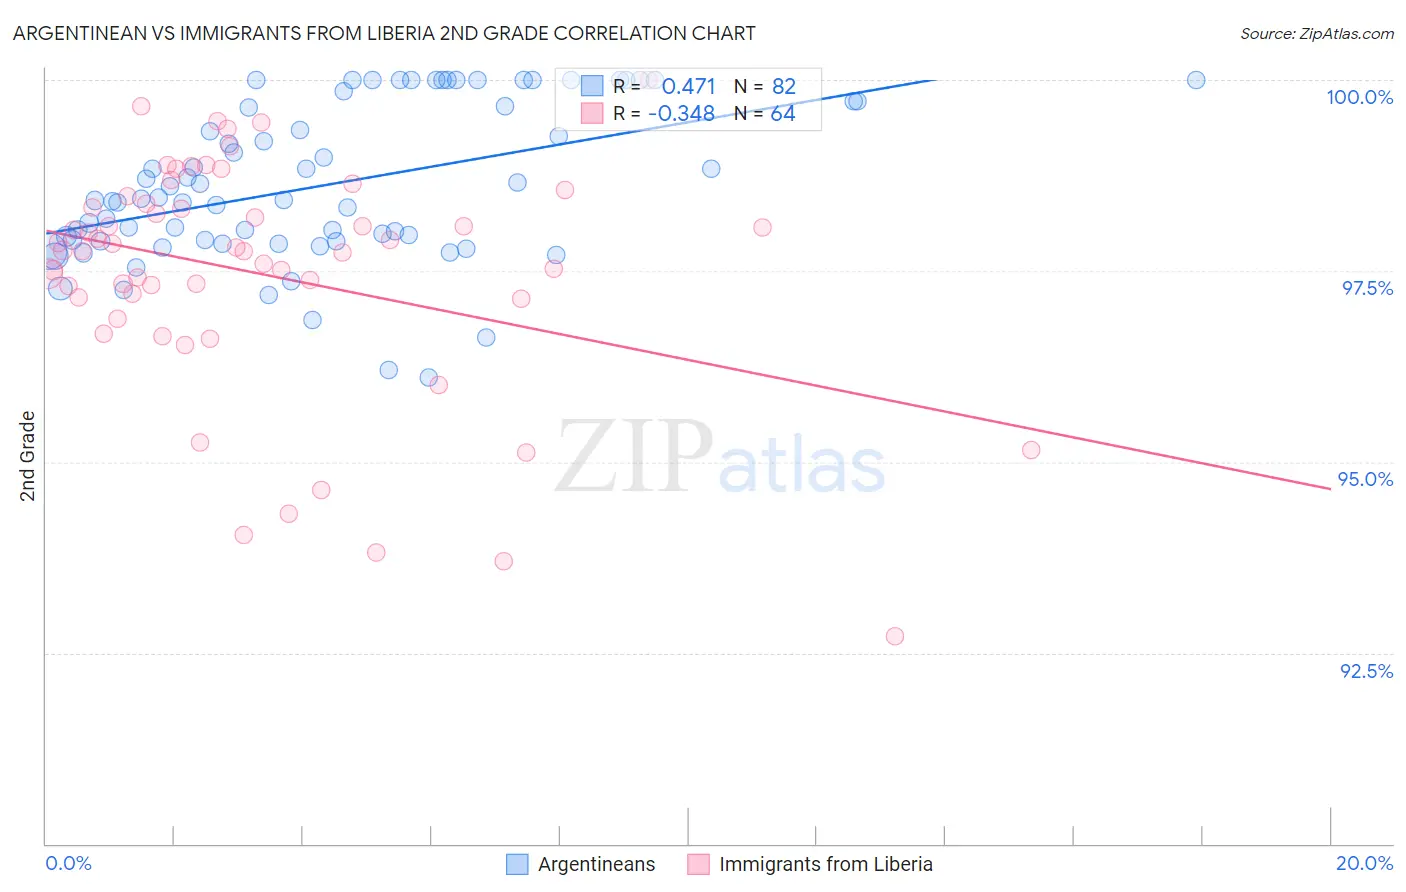
Argentinean vs Immigrants from Liberia 2nd Grade Correlation Chart
The statistical analysis conducted on geographies consisting of 297,146,811 people shows a moderate positive correlation between the proportion of Argentineans and percentage of population with at least 2nd grade education in the United States with a correlation coefficient (R) of 0.471 and weighted average of 97.9%. Similarly, the statistical analysis conducted on geographies consisting of 135,294,272 people shows a mild negative correlation between the proportion of Immigrants from Liberia and percentage of population with at least 2nd grade education in the United States with a correlation coefficient (R) of -0.348 and weighted average of 97.4%, a difference of 0.43%.
2nd Grade Correlation Summary
| Measurement | Argentinean | Immigrants from Liberia |
| Minimum | 96.1% | 92.7% |
| Maximum | 100.0% | 100.0% |
| Range | 3.9% | 7.3% |
| Mean | 98.6% | 97.5% |
| Median | 98.4% | 97.8% |
| Interquartile 25% (IQ1) | 97.9% | 97.1% |
| Interquartile 75% (IQ3) | 99.7% | 98.4% |
| Interquartile Range (IQR) | 1.8% | 1.2% |
| Standard Deviation (Sample) | 1.0% | 1.5% |
| Standard Deviation (Population) | 1.0% | 1.5% |
Similar Demographics by 2nd Grade
Demographics Similar to Argentineans by 2nd Grade
In terms of 2nd grade, the demographic groups most similar to Argentineans are Immigrants from Brazil (97.9%, a difference of 0.0%), Immigrants from Venezuela (97.9%, a difference of 0.0%), Immigrants from Micronesia (97.9%, a difference of 0.010%), Immigrants from Bosnia and Herzegovina (97.9%, a difference of 0.010%), and Immigrants from Sri Lanka (97.9%, a difference of 0.010%).
| Demographics | Rating | Rank | 2nd Grade |
| Albanians | 52.8 /100 | #171 | Average 97.9% |
| Immigrants | Korea | 52.7 /100 | #172 | Average 97.9% |
| Kenyans | 52.7 /100 | #173 | Average 97.9% |
| Immigrants | Micronesia | 50.0 /100 | #174 | Average 97.9% |
| Immigrants | Bosnia and Herzegovina | 49.8 /100 | #175 | Average 97.9% |
| Immigrants | Sri Lanka | 48.7 /100 | #176 | Average 97.9% |
| Immigrants | Brazil | 46.6 /100 | #177 | Average 97.9% |
| Argentineans | 46.3 /100 | #178 | Average 97.9% |
| Immigrants | Venezuela | 46.1 /100 | #179 | Average 97.9% |
| Natives/Alaskans | 44.3 /100 | #180 | Average 97.9% |
| Egyptians | 44.3 /100 | #181 | Average 97.9% |
| Portuguese | 42.4 /100 | #182 | Average 97.8% |
| Immigrants | Poland | 42.2 /100 | #183 | Average 97.8% |
| Immigrants | Belarus | 41.5 /100 | #184 | Average 97.8% |
| Immigrants | Argentina | 40.6 /100 | #185 | Average 97.8% |
Demographics Similar to Immigrants from Liberia by 2nd Grade
In terms of 2nd grade, the demographic groups most similar to Immigrants from Liberia are Taiwanese (97.4%, a difference of 0.0%), Immigrants from Ethiopia (97.4%, a difference of 0.0%), Immigrants from South America (97.4%, a difference of 0.0%), Immigrants from Sierra Leone (97.4%, a difference of 0.0%), and Yaqui (97.5%, a difference of 0.020%).
| Demographics | Rating | Rank | 2nd Grade |
| Immigrants | Colombia | 0.5 /100 | #257 | Tragic 97.5% |
| Yaqui | 0.5 /100 | #258 | Tragic 97.5% |
| Fijians | 0.5 /100 | #259 | Tragic 97.5% |
| Assyrians/Chaldeans/Syriacs | 0.5 /100 | #260 | Tragic 97.5% |
| Armenians | 0.5 /100 | #261 | Tragic 97.5% |
| Taiwanese | 0.4 /100 | #262 | Tragic 97.4% |
| Immigrants | Ethiopia | 0.4 /100 | #263 | Tragic 97.4% |
| Immigrants | Liberia | 0.4 /100 | #264 | Tragic 97.4% |
| Immigrants | South America | 0.4 /100 | #265 | Tragic 97.4% |
| Immigrants | Sierra Leone | 0.4 /100 | #266 | Tragic 97.4% |
| Cubans | 0.3 /100 | #267 | Tragic 97.4% |
| Immigrants | Nigeria | 0.3 /100 | #268 | Tragic 97.4% |
| West Indians | 0.3 /100 | #269 | Tragic 97.4% |
| Immigrants | Jamaica | 0.2 /100 | #270 | Tragic 97.4% |
| Immigrants | Cameroon | 0.2 /100 | #271 | Tragic 97.4% |