Immigrants from Dominican Republic vs Immigrants from Mexico 12th Grade, No Diploma
COMPARE
Immigrants from Dominican Republic
Immigrants from Mexico
12th Grade, No Diploma
12th Grade, No Diploma Comparison
Immigrants from Dominican Republic
Immigrants from Mexico
84.9%
12TH GRADE, NO DIPLOMA
0.0/ 100
METRIC RATING
334th/ 347
METRIC RANK
82.4%
12TH GRADE, NO DIPLOMA
0.0/ 100
METRIC RATING
347th/ 347
METRIC RANK
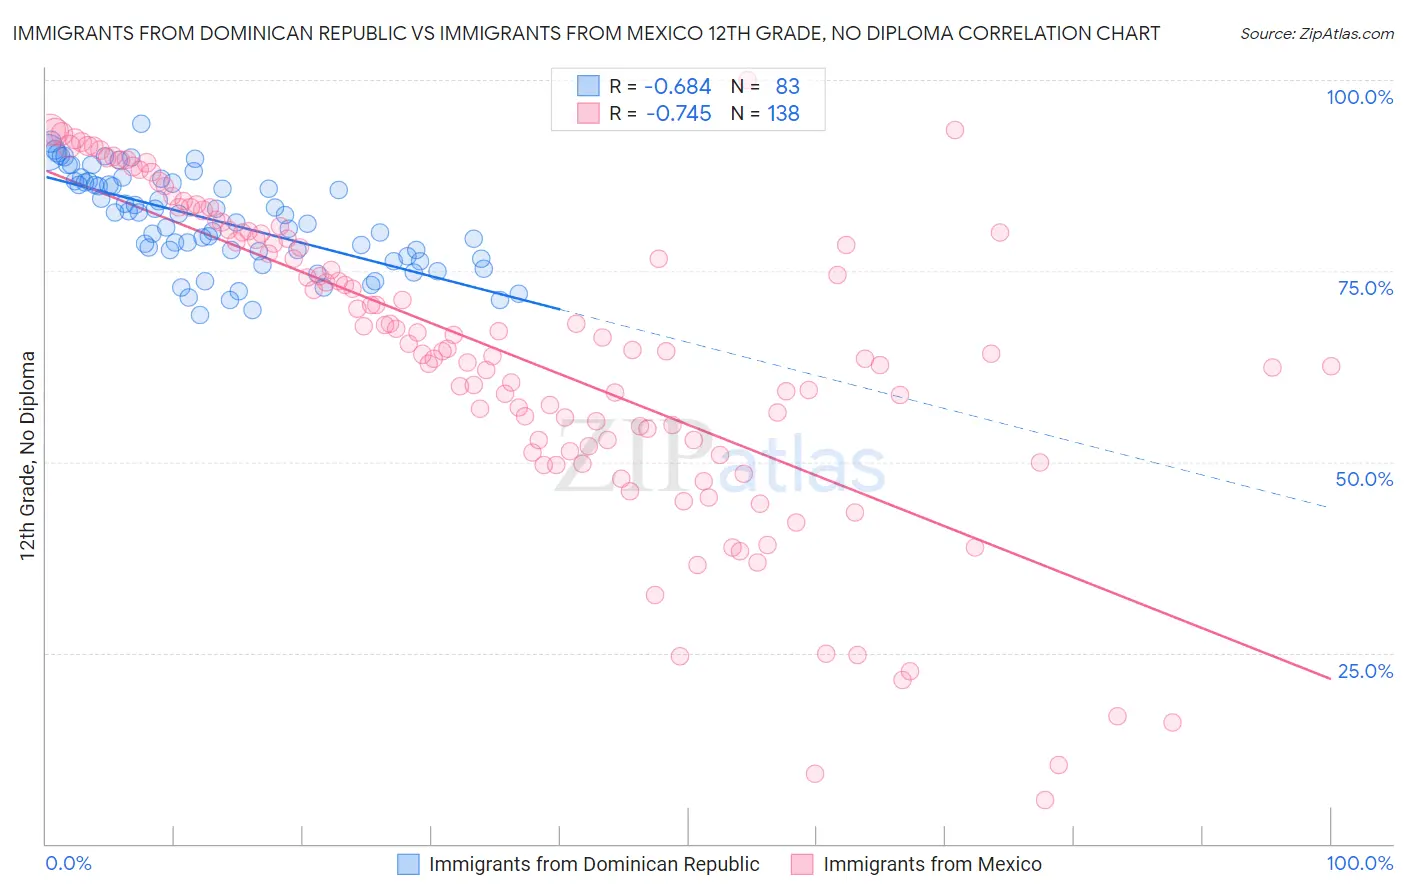
Immigrants from Dominican Republic vs Immigrants from Mexico 12th Grade, No Diploma Correlation Chart
The statistical analysis conducted on geographies consisting of 275,144,349 people shows a significant negative correlation between the proportion of Immigrants from Dominican Republic and percentage of population with at least 12th grade (no diploma) education in the United States with a correlation coefficient (R) of -0.684 and weighted average of 84.9%. Similarly, the statistical analysis conducted on geographies consisting of 513,766,297 people shows a strong negative correlation between the proportion of Immigrants from Mexico and percentage of population with at least 12th grade (no diploma) education in the United States with a correlation coefficient (R) of -0.745 and weighted average of 82.4%, a difference of 2.9%.
12th Grade, No Diploma Correlation Summary
| Measurement | Immigrants from Dominican Republic | Immigrants from Mexico |
| Minimum | 69.2% | 5.7% |
| Maximum | 94.2% | 100.0% |
| Range | 25.0% | 94.3% |
| Mean | 81.6% | 64.2% |
| Median | 82.3% | 64.7% |
| Interquartile 25% (IQ1) | 77.0% | 52.9% |
| Interquartile 75% (IQ3) | 86.5% | 80.0% |
| Interquartile Range (IQR) | 9.5% | 27.1% |
| Standard Deviation (Sample) | 6.2% | 20.2% |
| Standard Deviation (Population) | 6.1% | 20.1% |
Demographics Similar to Immigrants from Dominican Republic and Immigrants from Mexico by 12th Grade, No Diploma
In terms of 12th grade, no diploma, the demographic groups most similar to Immigrants from Dominican Republic are Immigrants from Yemen (84.8%, a difference of 0.040%), Immigrants from Latin America (85.0%, a difference of 0.14%), Tohono O'odham (84.7%, a difference of 0.18%), Immigrants from Honduras (85.0%, a difference of 0.21%), and Pima (84.6%, a difference of 0.32%). Similarly, the demographic groups most similar to Immigrants from Mexico are Yakama (82.5%, a difference of 0.040%), Spanish American Indian (82.9%, a difference of 0.58%), Immigrants from Central America (83.0%, a difference of 0.64%), Immigrants from El Salvador (83.6%, a difference of 1.4%), and Houma (83.7%, a difference of 1.5%).
| Demographics | Rating | Rank | 12th Grade, No Diploma |
| Hondurans | 0.0 /100 | #328 | Tragic 85.5% |
| Hispanics or Latinos | 0.0 /100 | #329 | Tragic 85.4% |
| Immigrants | Azores | 0.0 /100 | #330 | Tragic 85.3% |
| Central Americans | 0.0 /100 | #331 | Tragic 85.2% |
| Immigrants | Honduras | 0.0 /100 | #332 | Tragic 85.0% |
| Immigrants | Latin America | 0.0 /100 | #333 | Tragic 85.0% |
| Immigrants | Dominican Republic | 0.0 /100 | #334 | Tragic 84.9% |
| Immigrants | Yemen | 0.0 /100 | #335 | Tragic 84.8% |
| Tohono O'odham | 0.0 /100 | #336 | Tragic 84.7% |
| Pima | 0.0 /100 | #337 | Tragic 84.6% |
| Guatemalans | 0.0 /100 | #338 | Tragic 84.6% |
| Salvadorans | 0.0 /100 | #339 | Tragic 84.5% |
| Mexicans | 0.0 /100 | #340 | Tragic 84.1% |
| Immigrants | Guatemala | 0.0 /100 | #341 | Tragic 84.0% |
| Houma | 0.0 /100 | #342 | Tragic 83.7% |
| Immigrants | El Salvador | 0.0 /100 | #343 | Tragic 83.6% |
| Immigrants | Central America | 0.0 /100 | #344 | Tragic 83.0% |
| Spanish American Indians | 0.0 /100 | #345 | Tragic 82.9% |
| Yakama | 0.0 /100 | #346 | Tragic 82.5% |
| Immigrants | Mexico | 0.0 /100 | #347 | Tragic 82.4% |