Nicaraguan vs South African High School Diploma
COMPARE
Nicaraguan
South African
High School Diploma
High School Diploma Comparison
Nicaraguans
South Africans
84.1%
HIGH SCHOOL DIPLOMA
0.0/ 100
METRIC RATING
320th/ 347
METRIC RANK
90.6%
HIGH SCHOOL DIPLOMA
98.6/ 100
METRIC RATING
91st/ 347
METRIC RANK
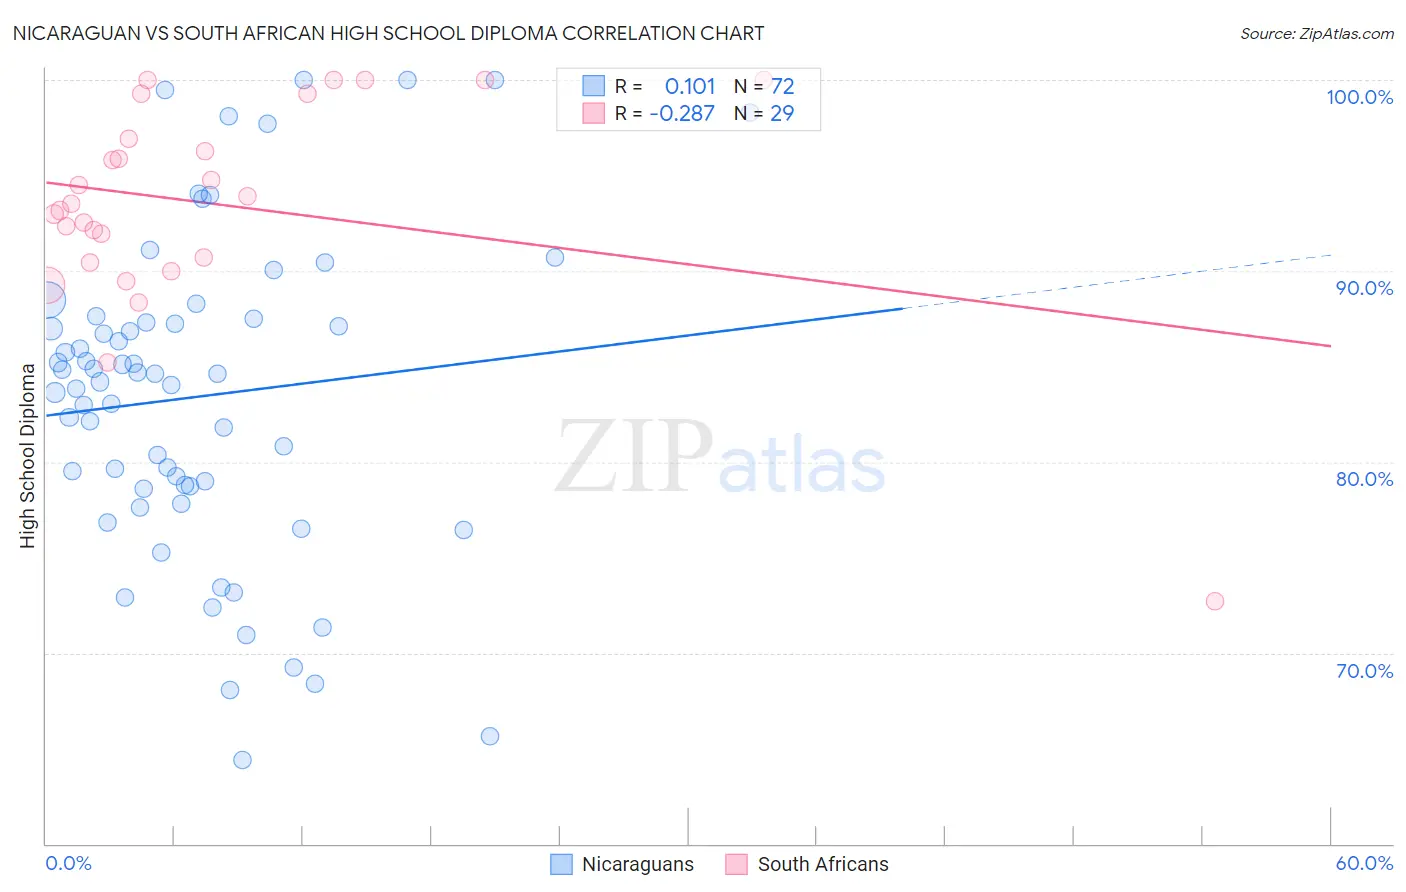
Nicaraguan vs South African High School Diploma Correlation Chart
The statistical analysis conducted on geographies consisting of 285,710,633 people shows a poor positive correlation between the proportion of Nicaraguans and percentage of population with at least high school diploma education in the United States with a correlation coefficient (R) of 0.101 and weighted average of 84.1%. Similarly, the statistical analysis conducted on geographies consisting of 182,604,532 people shows a weak negative correlation between the proportion of South Africans and percentage of population with at least high school diploma education in the United States with a correlation coefficient (R) of -0.287 and weighted average of 90.6%, a difference of 7.7%.
High School Diploma Correlation Summary
| Measurement | Nicaraguan | South African |
| Minimum | 64.4% | 72.7% |
| Maximum | 100.0% | 100.0% |
| Range | 35.6% | 27.3% |
| Mean | 83.4% | 93.5% |
| Median | 84.4% | 93.5% |
| Interquartile 25% (IQ1) | 78.7% | 90.6% |
| Interquartile 75% (IQ3) | 87.4% | 98.1% |
| Interquartile Range (IQR) | 8.8% | 7.5% |
| Standard Deviation (Sample) | 8.4% | 5.7% |
| Standard Deviation (Population) | 8.3% | 5.6% |
Similar Demographics by High School Diploma
Demographics Similar to Nicaraguans by High School Diploma
In terms of high school diploma, the demographic groups most similar to Nicaraguans are Central American Indian (84.2%, a difference of 0.10%), Immigrants from Belize (84.2%, a difference of 0.14%), Yuman (84.0%, a difference of 0.14%), Immigrants from Caribbean (84.3%, a difference of 0.21%), and Belizean (84.3%, a difference of 0.26%).
| Demographics | Rating | Rank | High School Diploma |
| Immigrants | Ecuador | 0.0 /100 | #313 | Tragic 84.8% |
| Yaqui | 0.0 /100 | #314 | Tragic 84.7% |
| Puerto Ricans | 0.0 /100 | #315 | Tragic 84.7% |
| Belizeans | 0.0 /100 | #316 | Tragic 84.3% |
| Immigrants | Caribbean | 0.0 /100 | #317 | Tragic 84.3% |
| Immigrants | Belize | 0.0 /100 | #318 | Tragic 84.2% |
| Central American Indians | 0.0 /100 | #319 | Tragic 84.2% |
| Nicaraguans | 0.0 /100 | #320 | Tragic 84.1% |
| Yuman | 0.0 /100 | #321 | Tragic 84.0% |
| Lumbee | 0.0 /100 | #322 | Tragic 83.6% |
| Immigrants | Cuba | 0.0 /100 | #323 | Tragic 83.5% |
| Immigrants | Cabo Verde | 0.0 /100 | #324 | Tragic 83.3% |
| Immigrants | Nicaragua | 0.0 /100 | #325 | Tragic 83.1% |
| Mexican American Indians | 0.0 /100 | #326 | Tragic 83.0% |
| Hondurans | 0.0 /100 | #327 | Tragic 83.0% |
Demographics Similar to South Africans by High School Diploma
In terms of high school diploma, the demographic groups most similar to South Africans are Swiss (90.6%, a difference of 0.010%), Celtic (90.6%, a difference of 0.020%), Immigrants from Western Europe (90.6%, a difference of 0.020%), Canadian (90.6%, a difference of 0.030%), and Immigrants from Israel (90.5%, a difference of 0.040%).
| Demographics | Rating | Rank | High School Diploma |
| Immigrants | Saudi Arabia | 99.1 /100 | #84 | Exceptional 90.7% |
| Romanians | 98.9 /100 | #85 | Exceptional 90.7% |
| Immigrants | Bulgaria | 98.9 /100 | #86 | Exceptional 90.6% |
| Immigrants | Turkey | 98.9 /100 | #87 | Exceptional 90.6% |
| Immigrants | France | 98.8 /100 | #88 | Exceptional 90.6% |
| Canadians | 98.7 /100 | #89 | Exceptional 90.6% |
| Celtics | 98.7 /100 | #90 | Exceptional 90.6% |
| South Africans | 98.6 /100 | #91 | Exceptional 90.6% |
| Swiss | 98.6 /100 | #92 | Exceptional 90.6% |
| Immigrants | Western Europe | 98.6 /100 | #93 | Exceptional 90.6% |
| Immigrants | Israel | 98.5 /100 | #94 | Exceptional 90.5% |
| Icelanders | 98.5 /100 | #95 | Exceptional 90.5% |
| Immigrants | Serbia | 98.4 /100 | #96 | Exceptional 90.5% |
| Immigrants | Kuwait | 98.3 /100 | #97 | Exceptional 90.5% |
| Immigrants | Korea | 98.3 /100 | #98 | Exceptional 90.5% |