Immigrants from Czechoslovakia vs Ghanaian 6th Grade
COMPARE
Immigrants from Czechoslovakia
Ghanaian
6th Grade
6th Grade Comparison
Immigrants from Czechoslovakia
Ghanaians
97.4%
6TH GRADE
97.3/ 100
METRIC RATING
109th/ 347
METRIC RANK
96.4%
6TH GRADE
0.2/ 100
METRIC RATING
266th/ 347
METRIC RANK
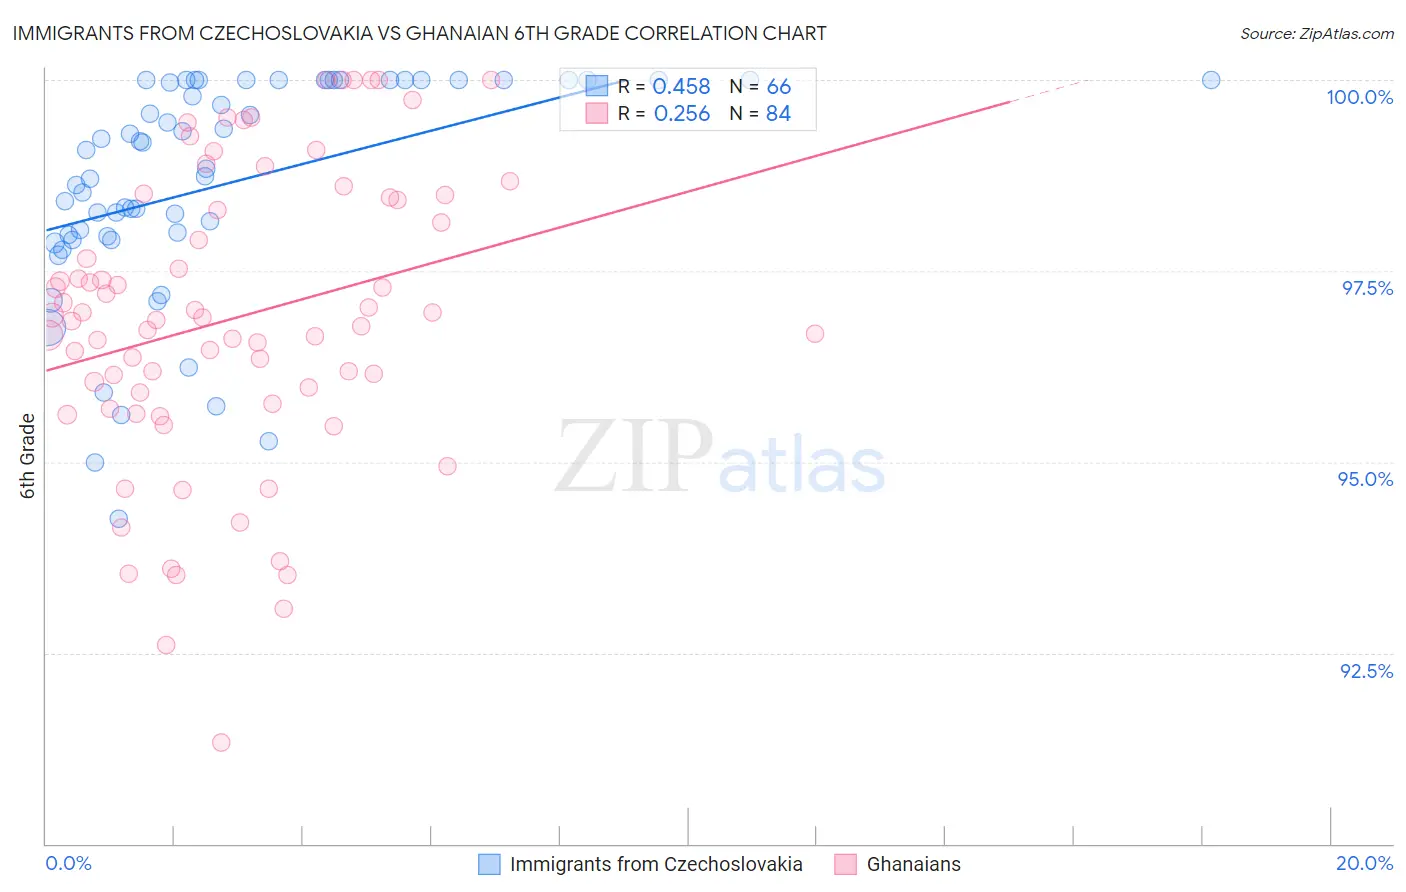
Immigrants from Czechoslovakia vs Ghanaian 6th Grade Correlation Chart
The statistical analysis conducted on geographies consisting of 195,448,060 people shows a moderate positive correlation between the proportion of Immigrants from Czechoslovakia and percentage of population with at least 6th grade education in the United States with a correlation coefficient (R) of 0.458 and weighted average of 97.4%. Similarly, the statistical analysis conducted on geographies consisting of 190,712,873 people shows a weak positive correlation between the proportion of Ghanaians and percentage of population with at least 6th grade education in the United States with a correlation coefficient (R) of 0.256 and weighted average of 96.4%, a difference of 1.1%.
6th Grade Correlation Summary
| Measurement | Immigrants from Czechoslovakia | Ghanaian |
| Minimum | 94.3% | 91.3% |
| Maximum | 100.0% | 100.0% |
| Range | 5.7% | 8.7% |
| Mean | 98.6% | 96.9% |
| Median | 99.0% | 96.9% |
| Interquartile 25% (IQ1) | 98.0% | 95.8% |
| Interquartile 75% (IQ3) | 100.0% | 98.4% |
| Interquartile Range (IQR) | 2.0% | 2.6% |
| Standard Deviation (Sample) | 1.5% | 1.9% |
| Standard Deviation (Population) | 1.4% | 1.9% |
Similar Demographics by 6th Grade
Demographics Similar to Immigrants from Czechoslovakia by 6th Grade
In terms of 6th grade, the demographic groups most similar to Immigrants from Czechoslovakia are Nonimmigrants (97.4%, a difference of 0.0%), Immigrants from Singapore (97.5%, a difference of 0.010%), Menominee (97.5%, a difference of 0.020%), Thai (97.4%, a difference of 0.020%), and Iroquois (97.4%, a difference of 0.020%).
| Demographics | Rating | Rank | 6th Grade |
| Choctaw | 98.0 /100 | #102 | Exceptional 97.5% |
| Bhutanese | 98.0 /100 | #103 | Exceptional 97.5% |
| German Russians | 97.9 /100 | #104 | Exceptional 97.5% |
| Cheyenne | 97.9 /100 | #105 | Exceptional 97.5% |
| Menominee | 97.7 /100 | #106 | Exceptional 97.5% |
| Immigrants | Singapore | 97.6 /100 | #107 | Exceptional 97.5% |
| Immigrants | Nonimmigrants | 97.3 /100 | #108 | Exceptional 97.4% |
| Immigrants | Czechoslovakia | 97.3 /100 | #109 | Exceptional 97.4% |
| Thais | 96.9 /100 | #110 | Exceptional 97.4% |
| Iroquois | 96.9 /100 | #111 | Exceptional 97.4% |
| Immigrants | Latvia | 96.7 /100 | #112 | Exceptional 97.4% |
| Immigrants | Saudi Arabia | 96.5 /100 | #113 | Exceptional 97.4% |
| Colville | 96.4 /100 | #114 | Exceptional 97.4% |
| Immigrants | Switzerland | 95.7 /100 | #115 | Exceptional 97.4% |
| Lebanese | 95.5 /100 | #116 | Exceptional 97.4% |
Demographics Similar to Ghanaians by 6th Grade
In terms of 6th grade, the demographic groups most similar to Ghanaians are Afghan (96.4%, a difference of 0.0%), Immigrants from Jamaica (96.4%, a difference of 0.010%), Immigrants from Colombia (96.4%, a difference of 0.020%), Armenian (96.4%, a difference of 0.020%), and Immigrants from Nigeria (96.4%, a difference of 0.030%).
| Demographics | Rating | Rank | 6th Grade |
| South Americans | 0.4 /100 | #259 | Tragic 96.4% |
| Peruvians | 0.4 /100 | #260 | Tragic 96.4% |
| Immigrants | Sierra Leone | 0.4 /100 | #261 | Tragic 96.4% |
| Immigrants | Nigeria | 0.3 /100 | #262 | Tragic 96.4% |
| Immigrants | Colombia | 0.3 /100 | #263 | Tragic 96.4% |
| Armenians | 0.3 /100 | #264 | Tragic 96.4% |
| Immigrants | Jamaica | 0.2 /100 | #265 | Tragic 96.4% |
| Ghanaians | 0.2 /100 | #266 | Tragic 96.4% |
| Afghans | 0.2 /100 | #267 | Tragic 96.4% |
| Immigrants | Uzbekistan | 0.2 /100 | #268 | Tragic 96.3% |
| West Indians | 0.2 /100 | #269 | Tragic 96.3% |
| Immigrants | South America | 0.2 /100 | #270 | Tragic 96.3% |
| Immigrants | Hong Kong | 0.2 /100 | #271 | Tragic 96.3% |
| Immigrants | Bolivia | 0.1 /100 | #272 | Tragic 96.3% |
| Immigrants | Cameroon | 0.1 /100 | #273 | Tragic 96.3% |