Immigrants from Czechoslovakia vs Celtic 9th Grade
COMPARE
Immigrants from Czechoslovakia
Celtic
9th Grade
9th Grade Comparison
Immigrants from Czechoslovakia
Celtics
95.7%
9TH GRADE
98.9/ 100
METRIC RATING
88th/ 347
METRIC RANK
96.0%
9TH GRADE
99.9/ 100
METRIC RATING
50th/ 347
METRIC RANK
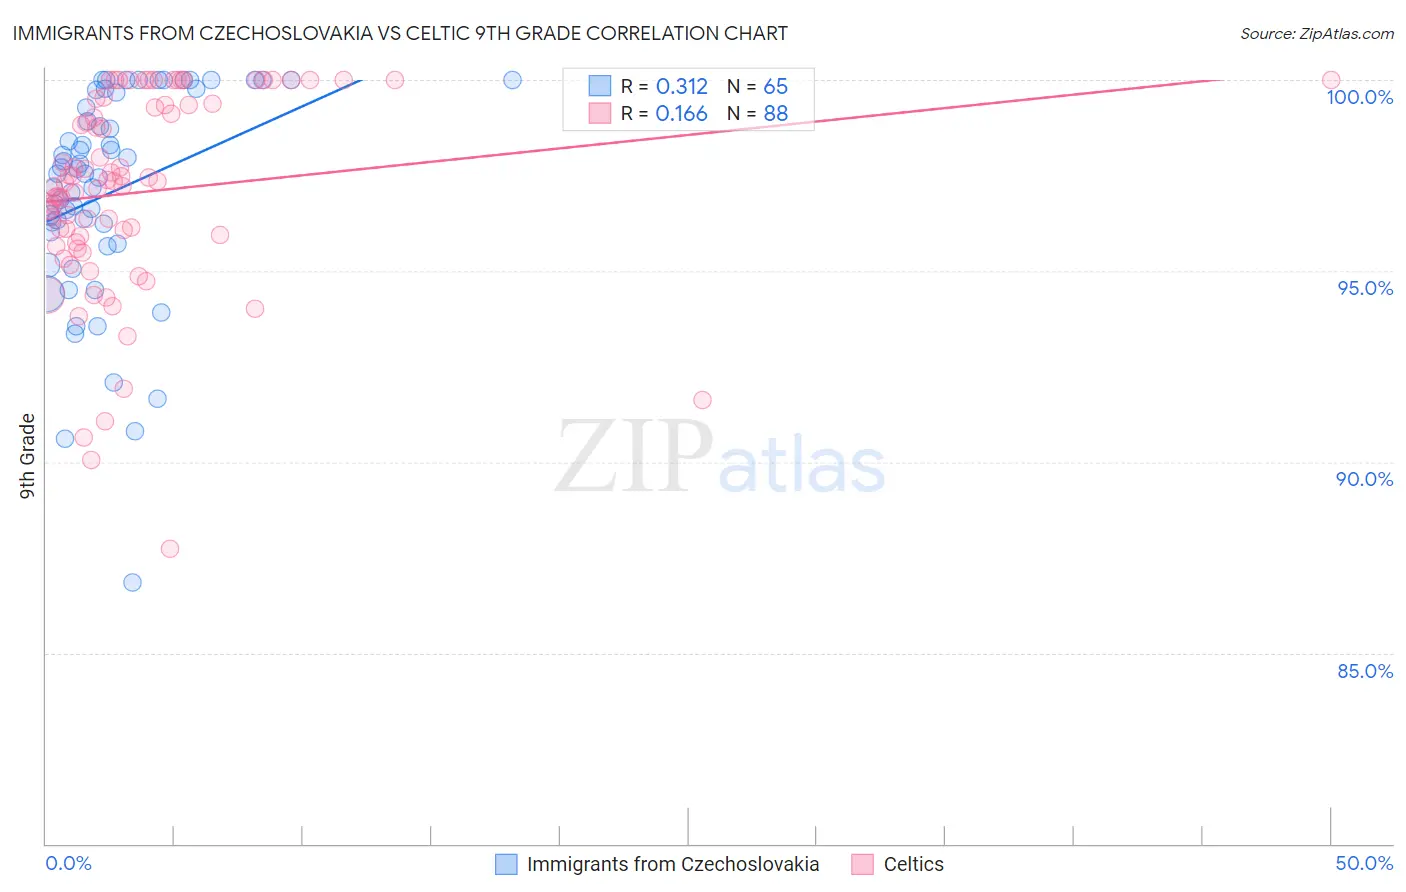
Immigrants from Czechoslovakia vs Celtic 9th Grade Correlation Chart
The statistical analysis conducted on geographies consisting of 195,448,106 people shows a mild positive correlation between the proportion of Immigrants from Czechoslovakia and percentage of population with at least 9th grade education in the United States with a correlation coefficient (R) of 0.312 and weighted average of 95.7%. Similarly, the statistical analysis conducted on geographies consisting of 168,876,981 people shows a poor positive correlation between the proportion of Celtics and percentage of population with at least 9th grade education in the United States with a correlation coefficient (R) of 0.166 and weighted average of 96.0%, a difference of 0.39%.
9th Grade Correlation Summary
| Measurement | Immigrants from Czechoslovakia | Celtic |
| Minimum | 86.9% | 87.7% |
| Maximum | 100.0% | 100.0% |
| Range | 13.1% | 12.3% |
| Mean | 97.1% | 97.1% |
| Median | 97.5% | 97.3% |
| Interquartile 25% (IQ1) | 95.9% | 95.8% |
| Interquartile 75% (IQ3) | 99.7% | 99.4% |
| Interquartile Range (IQR) | 3.8% | 3.5% |
| Standard Deviation (Sample) | 2.8% | 2.6% |
| Standard Deviation (Population) | 2.7% | 2.6% |
Similar Demographics by 9th Grade
Demographics Similar to Immigrants from Czechoslovakia by 9th Grade
In terms of 9th grade, the demographic groups most similar to Immigrants from Czechoslovakia are Yugoslavian (95.7%, a difference of 0.0%), Okinawan (95.7%, a difference of 0.010%), South African (95.6%, a difference of 0.010%), Creek (95.6%, a difference of 0.020%), and Immigrants from Saudi Arabia (95.6%, a difference of 0.020%).
| Demographics | Rating | Rank | 9th Grade |
| Arapaho | 99.3 /100 | #81 | Exceptional 95.7% |
| Puget Sound Salish | 99.2 /100 | #82 | Exceptional 95.7% |
| Swiss | 99.2 /100 | #83 | Exceptional 95.7% |
| Immigrants | Denmark | 99.1 /100 | #84 | Exceptional 95.7% |
| Icelanders | 99.1 /100 | #85 | Exceptional 95.7% |
| Immigrants | Western Europe | 99.1 /100 | #86 | Exceptional 95.7% |
| Okinawans | 99.0 /100 | #87 | Exceptional 95.7% |
| Immigrants | Czechoslovakia | 98.9 /100 | #88 | Exceptional 95.7% |
| Yugoslavians | 98.9 /100 | #89 | Exceptional 95.7% |
| South Africans | 98.8 /100 | #90 | Exceptional 95.6% |
| Creek | 98.8 /100 | #91 | Exceptional 95.6% |
| Immigrants | Saudi Arabia | 98.8 /100 | #92 | Exceptional 95.6% |
| Immigrants | Germany | 98.7 /100 | #93 | Exceptional 95.6% |
| Immigrants | Latvia | 98.7 /100 | #94 | Exceptional 95.6% |
| Americans | 98.5 /100 | #95 | Exceptional 95.6% |
Demographics Similar to Celtics by 9th Grade
In terms of 9th grade, the demographic groups most similar to Celtics are Greek (96.0%, a difference of 0.010%), Immigrants from Northern Europe (96.0%, a difference of 0.010%), Russian (96.0%, a difference of 0.020%), Australian (96.0%, a difference of 0.020%), and Serbian (96.0%, a difference of 0.020%).
| Demographics | Rating | Rank | 9th Grade |
| Iranians | 99.9 /100 | #43 | Exceptional 96.1% |
| Alaska Natives | 99.9 /100 | #44 | Exceptional 96.1% |
| Crow | 99.9 /100 | #45 | Exceptional 96.1% |
| Immigrants | India | 99.9 /100 | #46 | Exceptional 96.1% |
| Russians | 99.9 /100 | #47 | Exceptional 96.0% |
| Australians | 99.9 /100 | #48 | Exceptional 96.0% |
| Greeks | 99.9 /100 | #49 | Exceptional 96.0% |
| Celtics | 99.9 /100 | #50 | Exceptional 96.0% |
| Immigrants | Northern Europe | 99.9 /100 | #51 | Exceptional 96.0% |
| Serbians | 99.9 /100 | #52 | Exceptional 96.0% |
| Austrians | 99.8 /100 | #53 | Exceptional 96.0% |
| Immigrants | Canada | 99.8 /100 | #54 | Exceptional 96.0% |
| Immigrants | Austria | 99.8 /100 | #55 | Exceptional 96.0% |
| Immigrants | North America | 99.8 /100 | #56 | Exceptional 96.0% |
| Macedonians | 99.8 /100 | #57 | Exceptional 96.0% |