French Canadian vs Trinidadian and Tobagonian 3rd Grade
COMPARE
French Canadian
Trinidadian and Tobagonian
3rd Grade
3rd Grade Comparison
French Canadians
Trinidadians and Tobagonians
98.4%
3RD GRADE
100.0/ 100
METRIC RATING
29th/ 347
METRIC RANK
97.2%
3RD GRADE
0.1/ 100
METRIC RATING
277th/ 347
METRIC RANK
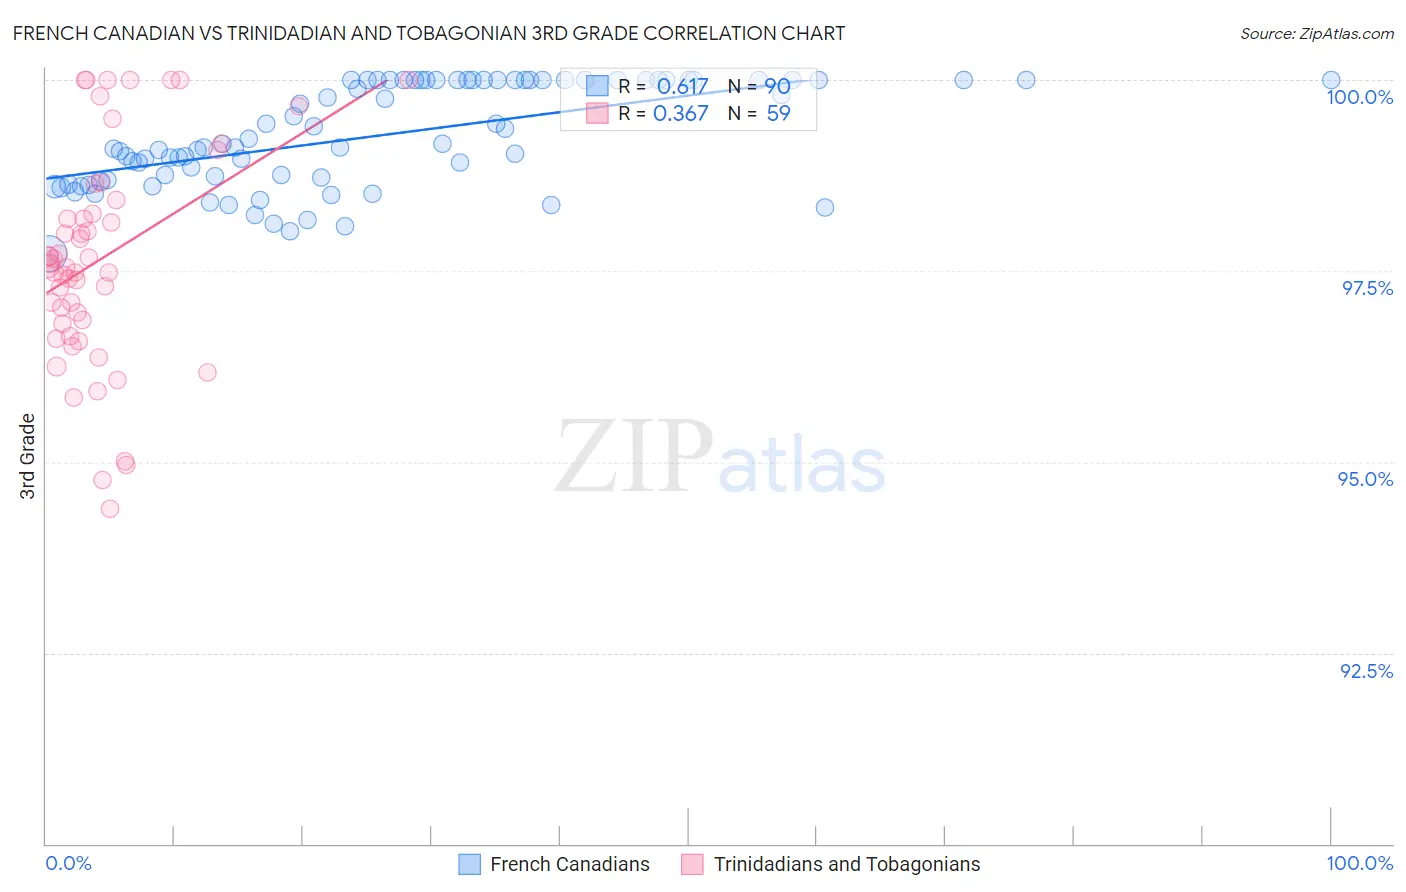
French Canadian vs Trinidadian and Tobagonian 3rd Grade Correlation Chart
The statistical analysis conducted on geographies consisting of 502,680,064 people shows a significant positive correlation between the proportion of French Canadians and percentage of population with at least 3rd grade education in the United States with a correlation coefficient (R) of 0.617 and weighted average of 98.4%. Similarly, the statistical analysis conducted on geographies consisting of 219,882,819 people shows a mild positive correlation between the proportion of Trinidadians and Tobagonians and percentage of population with at least 3rd grade education in the United States with a correlation coefficient (R) of 0.367 and weighted average of 97.2%, a difference of 1.3%.
3rd Grade Correlation Summary
| Measurement | French Canadian | Trinidadian and Tobagonian |
| Minimum | 97.7% | 94.4% |
| Maximum | 100.0% | 100.0% |
| Range | 2.3% | 5.6% |
| Mean | 99.3% | 97.7% |
| Median | 99.1% | 97.6% |
| Interquartile 25% (IQ1) | 98.7% | 96.8% |
| Interquartile 75% (IQ3) | 100.0% | 98.4% |
| Interquartile Range (IQR) | 1.3% | 1.6% |
| Standard Deviation (Sample) | 0.67% | 1.4% |
| Standard Deviation (Population) | 0.66% | 1.4% |
Similar Demographics by 3rd Grade
Demographics Similar to French Canadians by 3rd Grade
In terms of 3rd grade, the demographic groups most similar to French Canadians are European (98.4%, a difference of 0.0%), French (98.4%, a difference of 0.010%), Czech (98.4%, a difference of 0.010%), Scandinavian (98.4%, a difference of 0.010%), and Croatian (98.5%, a difference of 0.020%).
| Demographics | Rating | Rank | 3rd Grade |
| Finns | 100.0 /100 | #22 | Exceptional 98.5% |
| Sioux | 100.0 /100 | #23 | Exceptional 98.5% |
| Danes | 100.0 /100 | #24 | Exceptional 98.5% |
| Scotch-Irish | 100.0 /100 | #25 | Exceptional 98.5% |
| Aleuts | 100.0 /100 | #26 | Exceptional 98.5% |
| Croatians | 100.0 /100 | #27 | Exceptional 98.5% |
| French | 100.0 /100 | #28 | Exceptional 98.4% |
| French Canadians | 100.0 /100 | #29 | Exceptional 98.4% |
| Europeans | 100.0 /100 | #30 | Exceptional 98.4% |
| Czechs | 100.0 /100 | #31 | Exceptional 98.4% |
| Scandinavians | 100.0 /100 | #32 | Exceptional 98.4% |
| Chinese | 100.0 /100 | #33 | Exceptional 98.4% |
| Swiss | 100.0 /100 | #34 | Exceptional 98.4% |
| Arapaho | 100.0 /100 | #35 | Exceptional 98.4% |
| British | 99.9 /100 | #36 | Exceptional 98.4% |
Demographics Similar to Trinidadians and Tobagonians by 3rd Grade
In terms of 3rd grade, the demographic groups most similar to Trinidadians and Tobagonians are Immigrants from Bolivia (97.2%, a difference of 0.0%), Immigrants from Western Africa (97.2%, a difference of 0.0%), Immigrants from Philippines (97.2%, a difference of 0.010%), Immigrants from Ghana (97.2%, a difference of 0.010%), and Immigrants from Uzbekistan (97.2%, a difference of 0.020%).
| Demographics | Rating | Rank | 3rd Grade |
| Immigrants | China | 0.2 /100 | #270 | Tragic 97.2% |
| Puerto Ricans | 0.2 /100 | #271 | Tragic 97.2% |
| Ghanaians | 0.1 /100 | #272 | Tragic 97.2% |
| Immigrants | Peru | 0.1 /100 | #273 | Tragic 97.2% |
| Immigrants | Cameroon | 0.1 /100 | #274 | Tragic 97.2% |
| Immigrants | Uzbekistan | 0.1 /100 | #275 | Tragic 97.2% |
| Immigrants | Bolivia | 0.1 /100 | #276 | Tragic 97.2% |
| Trinidadians and Tobagonians | 0.1 /100 | #277 | Tragic 97.2% |
| Immigrants | Western Africa | 0.1 /100 | #278 | Tragic 97.2% |
| Immigrants | Philippines | 0.1 /100 | #279 | Tragic 97.2% |
| Immigrants | Ghana | 0.1 /100 | #280 | Tragic 97.2% |
| Barbadians | 0.1 /100 | #281 | Tragic 97.2% |
| Afghans | 0.1 /100 | #282 | Tragic 97.1% |
| Houma | 0.1 /100 | #283 | Tragic 97.1% |
| Immigrants | Trinidad and Tobago | 0.0 /100 | #284 | Tragic 97.1% |