Immigrants from Croatia vs Armenian 5th Grade
COMPARE
Immigrants from Croatia
Armenian
5th Grade
5th Grade Comparison
Immigrants from Croatia
Armenians
97.6%
5TH GRADE
95.5/ 100
METRIC RATING
116th/ 347
METRIC RANK
96.7%
5TH GRADE
0.3/ 100
METRIC RATING
268th/ 347
METRIC RANK
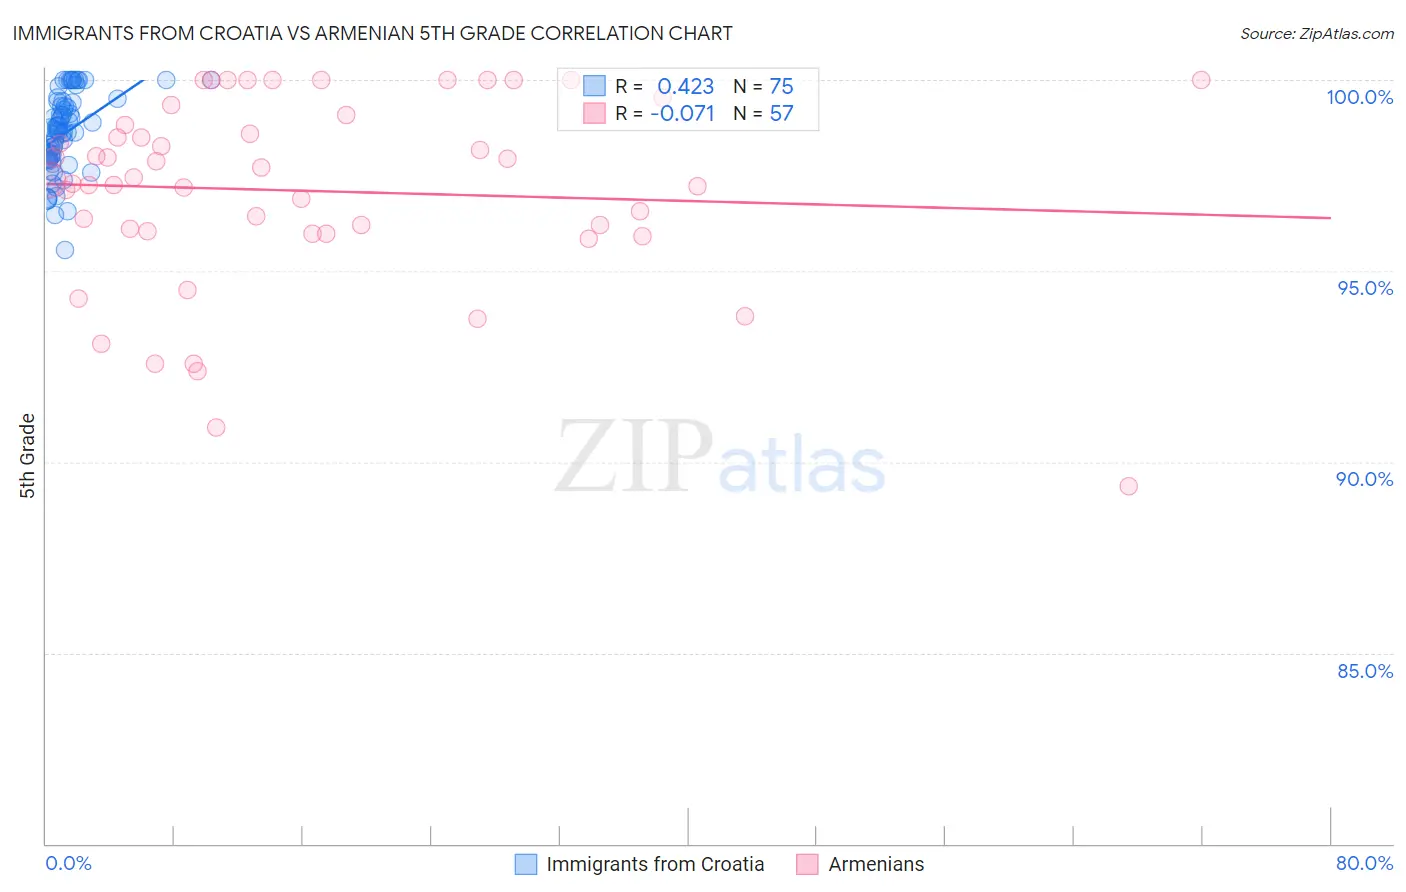
Immigrants from Croatia vs Armenian 5th Grade Correlation Chart
The statistical analysis conducted on geographies consisting of 132,508,207 people shows a moderate positive correlation between the proportion of Immigrants from Croatia and percentage of population with at least 5th grade education in the United States with a correlation coefficient (R) of 0.423 and weighted average of 97.6%. Similarly, the statistical analysis conducted on geographies consisting of 310,954,801 people shows a slight negative correlation between the proportion of Armenians and percentage of population with at least 5th grade education in the United States with a correlation coefficient (R) of -0.071 and weighted average of 96.7%, a difference of 0.94%.
5th Grade Correlation Summary
| Measurement | Immigrants from Croatia | Armenian |
| Minimum | 95.5% | 89.4% |
| Maximum | 100.0% | 100.0% |
| Range | 4.5% | 10.6% |
| Mean | 98.6% | 97.1% |
| Median | 98.7% | 97.4% |
| Interquartile 25% (IQ1) | 97.9% | 96.0% |
| Interquartile 75% (IQ3) | 99.4% | 99.0% |
| Interquartile Range (IQR) | 1.5% | 2.9% |
| Standard Deviation (Sample) | 1.0% | 2.5% |
| Standard Deviation (Population) | 1.0% | 2.5% |
Similar Demographics by 5th Grade
Demographics Similar to Immigrants from Croatia by 5th Grade
In terms of 5th grade, the demographic groups most similar to Immigrants from Croatia are Lebanese (97.6%, a difference of 0.0%), Okinawan (97.6%, a difference of 0.0%), Immigrants from Saudi Arabia (97.6%, a difference of 0.0%), Immigrants from Switzerland (97.7%, a difference of 0.010%), and Iroquois (97.7%, a difference of 0.010%).
| Demographics | Rating | Rank | 5th Grade |
| Immigrants | Latvia | 97.1 /100 | #109 | Exceptional 97.7% |
| Thais | 96.9 /100 | #110 | Exceptional 97.7% |
| Menominee | 96.3 /100 | #111 | Exceptional 97.7% |
| Immigrants | Switzerland | 96.0 /100 | #112 | Exceptional 97.7% |
| Iroquois | 95.9 /100 | #113 | Exceptional 97.7% |
| Lebanese | 95.7 /100 | #114 | Exceptional 97.6% |
| Okinawans | 95.7 /100 | #115 | Exceptional 97.6% |
| Immigrants | Croatia | 95.5 /100 | #116 | Exceptional 97.6% |
| Immigrants | Saudi Arabia | 95.4 /100 | #117 | Exceptional 97.6% |
| Basques | 95.2 /100 | #118 | Exceptional 97.6% |
| Syrians | 95.1 /100 | #119 | Exceptional 97.6% |
| Immigrants | Zimbabwe | 94.9 /100 | #120 | Exceptional 97.6% |
| Immigrants | France | 94.8 /100 | #121 | Exceptional 97.6% |
| Immigrants | Japan | 94.7 /100 | #122 | Exceptional 97.6% |
| Immigrants | Norway | 94.6 /100 | #123 | Exceptional 97.6% |
Demographics Similar to Armenians by 5th Grade
In terms of 5th grade, the demographic groups most similar to Armenians are Immigrants from Nigeria (96.7%, a difference of 0.010%), Immigrants from South America (96.7%, a difference of 0.010%), Ghanaian (96.7%, a difference of 0.010%), West Indian (96.8%, a difference of 0.020%), and Taiwanese (96.7%, a difference of 0.020%).
| Demographics | Rating | Rank | 5th Grade |
| Immigrants | Sierra Leone | 0.4 /100 | #261 | Tragic 96.8% |
| Immigrants | Colombia | 0.4 /100 | #262 | Tragic 96.8% |
| Immigrants | Uzbekistan | 0.3 /100 | #263 | Tragic 96.8% |
| West Indians | 0.3 /100 | #264 | Tragic 96.8% |
| Taiwanese | 0.3 /100 | #265 | Tragic 96.7% |
| Immigrants | Nigeria | 0.3 /100 | #266 | Tragic 96.7% |
| Immigrants | South America | 0.3 /100 | #267 | Tragic 96.7% |
| Armenians | 0.3 /100 | #268 | Tragic 96.7% |
| Ghanaians | 0.2 /100 | #269 | Tragic 96.7% |
| Afghans | 0.2 /100 | #270 | Tragic 96.7% |
| Immigrants | Hong Kong | 0.2 /100 | #271 | Tragic 96.7% |
| Trinidadians and Tobagonians | 0.1 /100 | #272 | Tragic 96.7% |
| Yaqui | 0.1 /100 | #273 | Tragic 96.7% |
| Immigrants | Cameroon | 0.1 /100 | #274 | Tragic 96.7% |
| Immigrants | Peru | 0.1 /100 | #275 | Tragic 96.6% |