Immigrants from Croatia vs Vietnamese 5th Grade
COMPARE
Immigrants from Croatia
Vietnamese
5th Grade
5th Grade Comparison
Immigrants from Croatia
Vietnamese
97.6%
5TH GRADE
95.5/ 100
METRIC RATING
116th/ 347
METRIC RANK
95.9%
5TH GRADE
0.0/ 100
METRIC RATING
312th/ 347
METRIC RANK
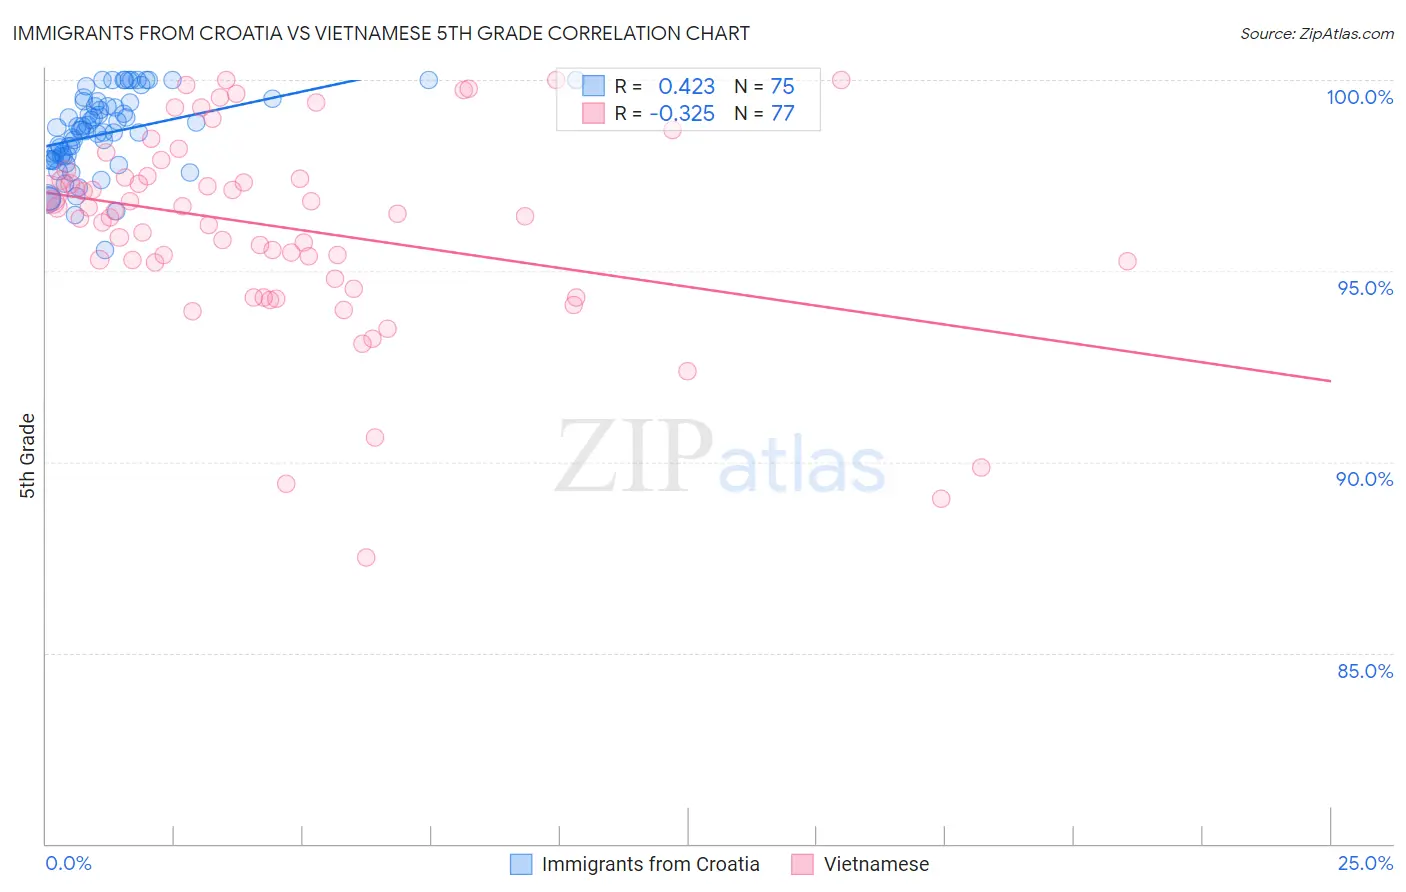
Immigrants from Croatia vs Vietnamese 5th Grade Correlation Chart
The statistical analysis conducted on geographies consisting of 132,508,207 people shows a moderate positive correlation between the proportion of Immigrants from Croatia and percentage of population with at least 5th grade education in the United States with a correlation coefficient (R) of 0.423 and weighted average of 97.6%. Similarly, the statistical analysis conducted on geographies consisting of 170,728,240 people shows a mild negative correlation between the proportion of Vietnamese and percentage of population with at least 5th grade education in the United States with a correlation coefficient (R) of -0.325 and weighted average of 95.9%, a difference of 1.8%.
5th Grade Correlation Summary
| Measurement | Immigrants from Croatia | Vietnamese |
| Minimum | 95.5% | 87.5% |
| Maximum | 100.0% | 100.0% |
| Range | 4.5% | 12.5% |
| Mean | 98.6% | 96.1% |
| Median | 98.7% | 96.5% |
| Interquartile 25% (IQ1) | 97.9% | 95.0% |
| Interquartile 75% (IQ3) | 99.4% | 97.5% |
| Interquartile Range (IQR) | 1.5% | 2.5% |
| Standard Deviation (Sample) | 1.0% | 2.6% |
| Standard Deviation (Population) | 1.0% | 2.6% |
Similar Demographics by 5th Grade
Demographics Similar to Immigrants from Croatia by 5th Grade
In terms of 5th grade, the demographic groups most similar to Immigrants from Croatia are Lebanese (97.6%, a difference of 0.0%), Okinawan (97.6%, a difference of 0.0%), Immigrants from Saudi Arabia (97.6%, a difference of 0.0%), Immigrants from Switzerland (97.7%, a difference of 0.010%), and Iroquois (97.7%, a difference of 0.010%).
| Demographics | Rating | Rank | 5th Grade |
| Immigrants | Latvia | 97.1 /100 | #109 | Exceptional 97.7% |
| Thais | 96.9 /100 | #110 | Exceptional 97.7% |
| Menominee | 96.3 /100 | #111 | Exceptional 97.7% |
| Immigrants | Switzerland | 96.0 /100 | #112 | Exceptional 97.7% |
| Iroquois | 95.9 /100 | #113 | Exceptional 97.7% |
| Lebanese | 95.7 /100 | #114 | Exceptional 97.6% |
| Okinawans | 95.7 /100 | #115 | Exceptional 97.6% |
| Immigrants | Croatia | 95.5 /100 | #116 | Exceptional 97.6% |
| Immigrants | Saudi Arabia | 95.4 /100 | #117 | Exceptional 97.6% |
| Basques | 95.2 /100 | #118 | Exceptional 97.6% |
| Syrians | 95.1 /100 | #119 | Exceptional 97.6% |
| Immigrants | Zimbabwe | 94.9 /100 | #120 | Exceptional 97.6% |
| Immigrants | France | 94.8 /100 | #121 | Exceptional 97.6% |
| Immigrants | Japan | 94.7 /100 | #122 | Exceptional 97.6% |
| Immigrants | Norway | 94.6 /100 | #123 | Exceptional 97.6% |
Demographics Similar to Vietnamese by 5th Grade
In terms of 5th grade, the demographic groups most similar to Vietnamese are Bangladeshi (95.9%, a difference of 0.020%), Immigrants from Portugal (95.9%, a difference of 0.020%), Immigrants from Bangladesh (96.0%, a difference of 0.030%), Nicaraguan (95.9%, a difference of 0.040%), and Indonesian (96.0%, a difference of 0.050%).
| Demographics | Rating | Rank | 5th Grade |
| Immigrants | Laos | 0.0 /100 | #305 | Tragic 96.0% |
| Immigrants | Haiti | 0.0 /100 | #306 | Tragic 96.0% |
| Immigrants | Caribbean | 0.0 /100 | #307 | Tragic 96.0% |
| Ecuadorians | 0.0 /100 | #308 | Tragic 96.0% |
| Immigrants | Guyana | 0.0 /100 | #309 | Tragic 96.0% |
| Indonesians | 0.0 /100 | #310 | Tragic 96.0% |
| Immigrants | Bangladesh | 0.0 /100 | #311 | Tragic 96.0% |
| Vietnamese | 0.0 /100 | #312 | Tragic 95.9% |
| Bangladeshis | 0.0 /100 | #313 | Tragic 95.9% |
| Immigrants | Portugal | 0.0 /100 | #314 | Tragic 95.9% |
| Nicaraguans | 0.0 /100 | #315 | Tragic 95.9% |
| Immigrants | Ecuador | 0.0 /100 | #316 | Tragic 95.8% |
| Belizeans | 0.0 /100 | #317 | Tragic 95.8% |
| Immigrants | Vietnam | 0.0 /100 | #318 | Tragic 95.8% |
| Japanese | 0.0 /100 | #319 | Tragic 95.7% |