Immigrants from Lithuania vs Armenian 5th Grade
COMPARE
Immigrants from Lithuania
Armenian
5th Grade
5th Grade Comparison
Immigrants from Lithuania
Armenians
97.8%
5TH GRADE
99.2/ 100
METRIC RATING
79th/ 347
METRIC RANK
96.7%
5TH GRADE
0.3/ 100
METRIC RATING
268th/ 347
METRIC RANK
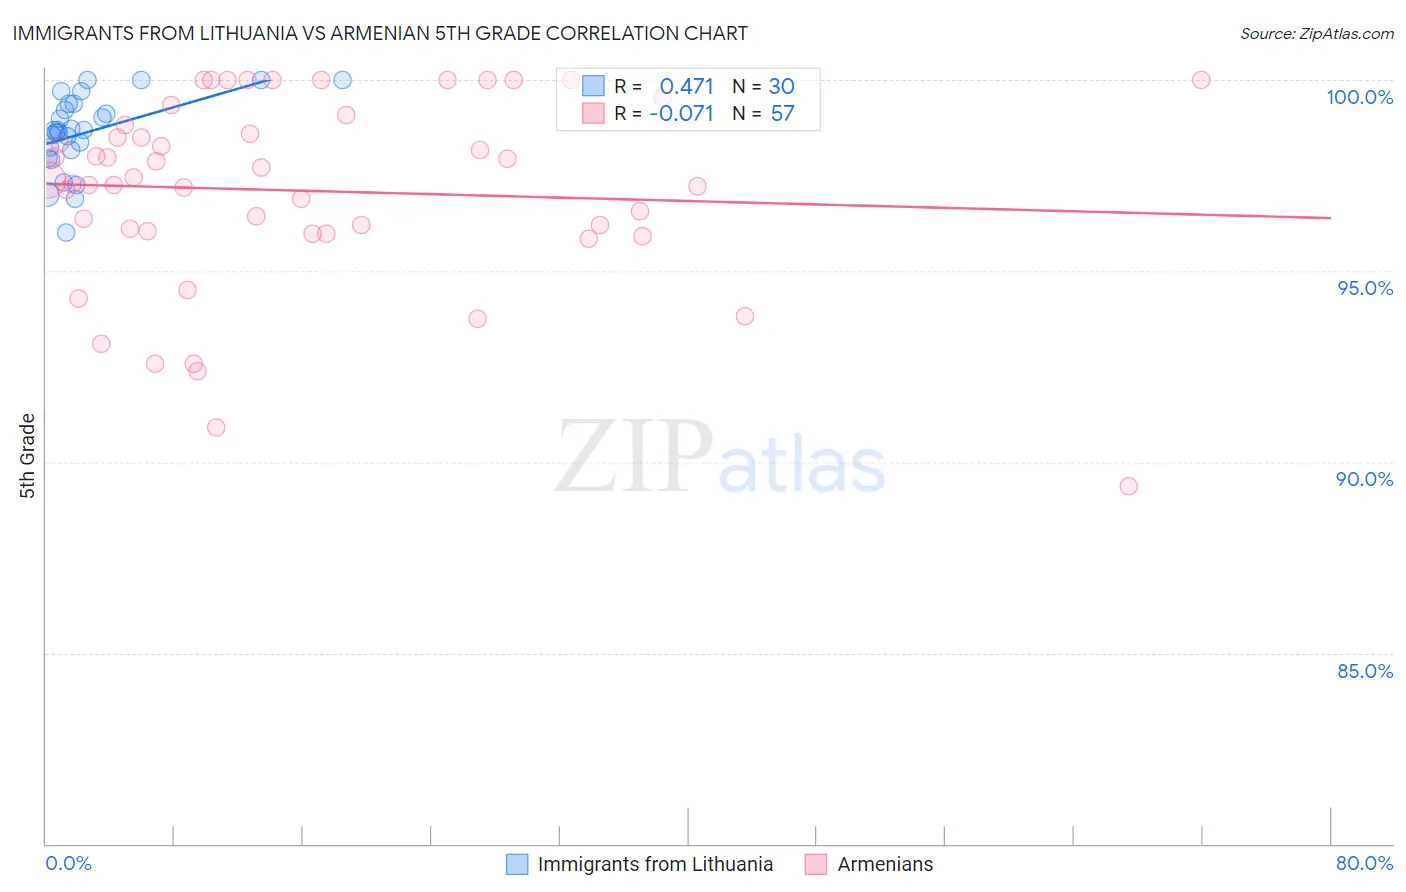
Immigrants from Lithuania vs Armenian 5th Grade Correlation Chart
The statistical analysis conducted on geographies consisting of 117,724,932 people shows a moderate positive correlation between the proportion of Immigrants from Lithuania and percentage of population with at least 5th grade education in the United States with a correlation coefficient (R) of 0.471 and weighted average of 97.8%. Similarly, the statistical analysis conducted on geographies consisting of 310,954,801 people shows a slight negative correlation between the proportion of Armenians and percentage of population with at least 5th grade education in the United States with a correlation coefficient (R) of -0.071 and weighted average of 96.7%, a difference of 1.1%.
5th Grade Correlation Summary
| Measurement | Immigrants from Lithuania | Armenian |
| Minimum | 96.0% | 89.4% |
| Maximum | 100.0% | 100.0% |
| Range | 4.0% | 10.6% |
| Mean | 98.6% | 97.1% |
| Median | 98.7% | 97.4% |
| Interquartile 25% (IQ1) | 98.2% | 96.0% |
| Interquartile 75% (IQ3) | 99.4% | 99.0% |
| Interquartile Range (IQR) | 1.2% | 2.9% |
| Standard Deviation (Sample) | 1.0% | 2.5% |
| Standard Deviation (Population) | 0.99% | 2.5% |
Similar Demographics by 5th Grade
Demographics Similar to Immigrants from Lithuania by 5th Grade
In terms of 5th grade, the demographic groups most similar to Immigrants from Lithuania are Immigrants from India (97.8%, a difference of 0.0%), Icelander (97.8%, a difference of 0.0%), Ukrainian (97.8%, a difference of 0.010%), Immigrants from Netherlands (97.8%, a difference of 0.010%), and Immigrants from England (97.8%, a difference of 0.010%).
| Demographics | Rating | Rank | 5th Grade |
| Macedonians | 99.4 /100 | #72 | Exceptional 97.9% |
| Cherokee | 99.4 /100 | #73 | Exceptional 97.8% |
| Lumbee | 99.3 /100 | #74 | Exceptional 97.8% |
| Ukrainians | 99.3 /100 | #75 | Exceptional 97.8% |
| Immigrants | Netherlands | 99.3 /100 | #76 | Exceptional 97.8% |
| Immigrants | England | 99.3 /100 | #77 | Exceptional 97.8% |
| Osage | 99.3 /100 | #78 | Exceptional 97.8% |
| Immigrants | Lithuania | 99.2 /100 | #79 | Exceptional 97.8% |
| Immigrants | India | 99.2 /100 | #80 | Exceptional 97.8% |
| Icelanders | 99.2 /100 | #81 | Exceptional 97.8% |
| Pueblo | 99.2 /100 | #82 | Exceptional 97.8% |
| Zimbabweans | 99.0 /100 | #83 | Exceptional 97.8% |
| Potawatomi | 99.0 /100 | #84 | Exceptional 97.8% |
| Immigrants | Belgium | 99.0 /100 | #85 | Exceptional 97.8% |
| Cypriots | 98.9 /100 | #86 | Exceptional 97.8% |
Demographics Similar to Armenians by 5th Grade
In terms of 5th grade, the demographic groups most similar to Armenians are Immigrants from Nigeria (96.7%, a difference of 0.010%), Immigrants from South America (96.7%, a difference of 0.010%), Ghanaian (96.7%, a difference of 0.010%), West Indian (96.8%, a difference of 0.020%), and Taiwanese (96.7%, a difference of 0.020%).
| Demographics | Rating | Rank | 5th Grade |
| Immigrants | Sierra Leone | 0.4 /100 | #261 | Tragic 96.8% |
| Immigrants | Colombia | 0.4 /100 | #262 | Tragic 96.8% |
| Immigrants | Uzbekistan | 0.3 /100 | #263 | Tragic 96.8% |
| West Indians | 0.3 /100 | #264 | Tragic 96.8% |
| Taiwanese | 0.3 /100 | #265 | Tragic 96.7% |
| Immigrants | Nigeria | 0.3 /100 | #266 | Tragic 96.7% |
| Immigrants | South America | 0.3 /100 | #267 | Tragic 96.7% |
| Armenians | 0.3 /100 | #268 | Tragic 96.7% |
| Ghanaians | 0.2 /100 | #269 | Tragic 96.7% |
| Afghans | 0.2 /100 | #270 | Tragic 96.7% |
| Immigrants | Hong Kong | 0.2 /100 | #271 | Tragic 96.7% |
| Trinidadians and Tobagonians | 0.1 /100 | #272 | Tragic 96.7% |
| Yaqui | 0.1 /100 | #273 | Tragic 96.7% |
| Immigrants | Cameroon | 0.1 /100 | #274 | Tragic 96.7% |
| Immigrants | Peru | 0.1 /100 | #275 | Tragic 96.6% |