Immigrants from Costa Rica vs Mexican 7th Grade
COMPARE
Immigrants from Costa Rica
Mexican
7th Grade
7th Grade Comparison
Immigrants from Costa Rica
Mexicans
95.3%
7TH GRADE
0.6/ 100
METRIC RATING
259th/ 347
METRIC RANK
91.9%
7TH GRADE
0.0/ 100
METRIC RATING
339th/ 347
METRIC RANK
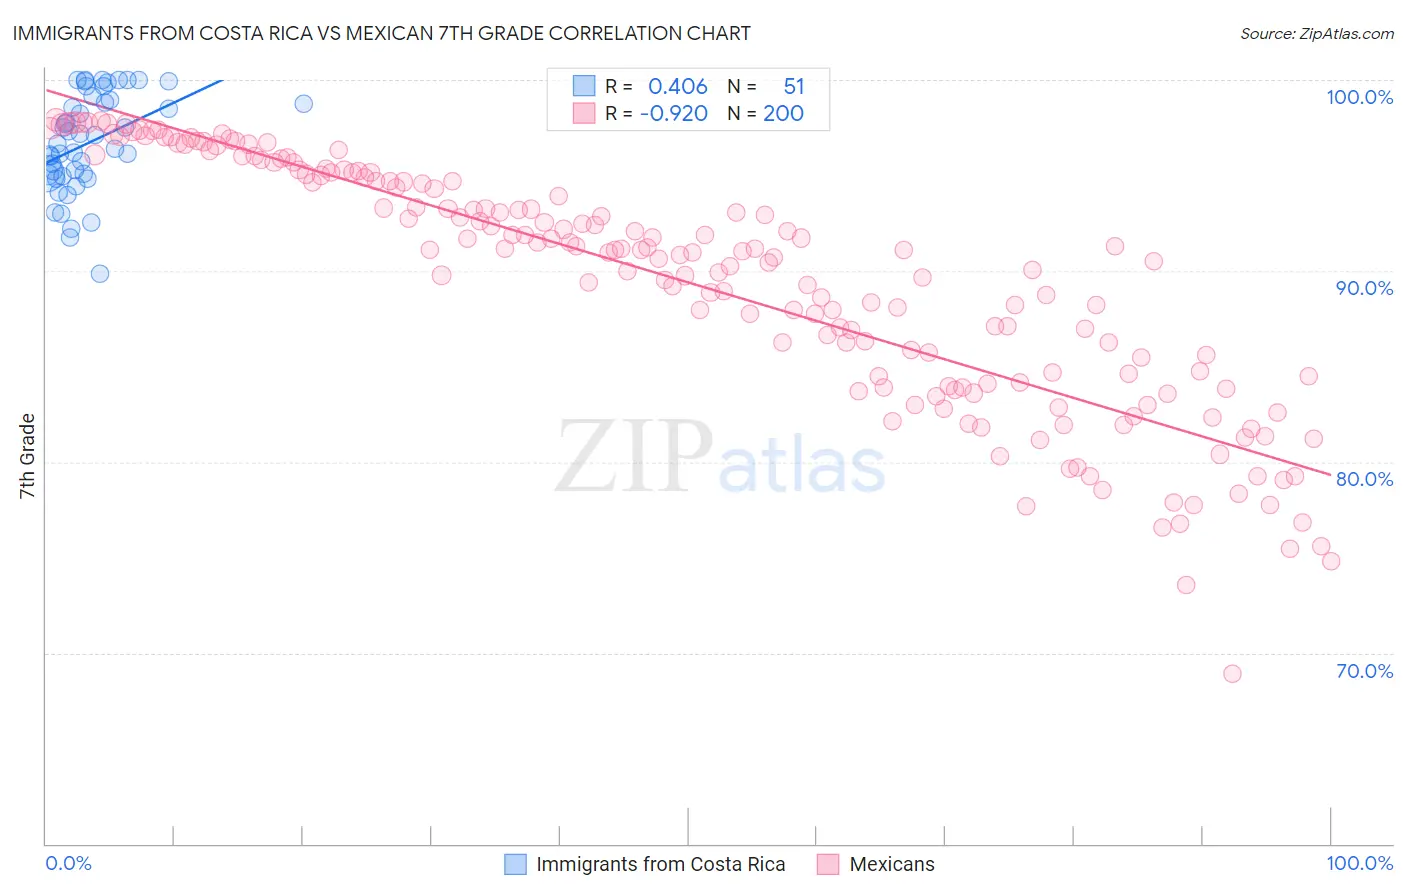
Immigrants from Costa Rica vs Mexican 7th Grade Correlation Chart
The statistical analysis conducted on geographies consisting of 204,272,182 people shows a moderate positive correlation between the proportion of Immigrants from Costa Rica and percentage of population with at least 7th grade education in the United States with a correlation coefficient (R) of 0.406 and weighted average of 95.3%. Similarly, the statistical analysis conducted on geographies consisting of 565,339,785 people shows a near-perfect negative correlation between the proportion of Mexicans and percentage of population with at least 7th grade education in the United States with a correlation coefficient (R) of -0.920 and weighted average of 91.9%, a difference of 3.7%.
7th Grade Correlation Summary
| Measurement | Immigrants from Costa Rica | Mexican |
| Minimum | 89.8% | 68.9% |
| Maximum | 100.0% | 97.9% |
| Range | 10.2% | 29.0% |
| Mean | 96.7% | 89.4% |
| Median | 96.7% | 91.0% |
| Interquartile 25% (IQ1) | 95.0% | 84.3% |
| Interquartile 75% (IQ3) | 98.9% | 94.8% |
| Interquartile Range (IQR) | 3.9% | 10.5% |
| Standard Deviation (Sample) | 2.6% | 6.3% |
| Standard Deviation (Population) | 2.5% | 6.3% |
Similar Demographics by 7th Grade
Demographics Similar to Immigrants from Costa Rica by 7th Grade
In terms of 7th grade, the demographic groups most similar to Immigrants from Costa Rica are Immigrants from China (95.3%, a difference of 0.030%), Immigrants from Congo (95.3%, a difference of 0.030%), Ghanaian (95.3%, a difference of 0.030%), Afghan (95.3%, a difference of 0.030%), and Korean (95.3%, a difference of 0.040%).
| Demographics | Rating | Rank | 7th Grade |
| Immigrants | Ethiopia | 0.9 /100 | #252 | Tragic 95.3% |
| Somalis | 0.9 /100 | #253 | Tragic 95.3% |
| Colombians | 0.8 /100 | #254 | Tragic 95.3% |
| Koreans | 0.8 /100 | #255 | Tragic 95.3% |
| Immigrants | China | 0.7 /100 | #256 | Tragic 95.3% |
| Immigrants | Congo | 0.7 /100 | #257 | Tragic 95.3% |
| Ghanaians | 0.7 /100 | #258 | Tragic 95.3% |
| Immigrants | Costa Rica | 0.6 /100 | #259 | Tragic 95.3% |
| Afghans | 0.5 /100 | #260 | Tragic 95.3% |
| South Americans | 0.5 /100 | #261 | Tragic 95.2% |
| Immigrants | Somalia | 0.5 /100 | #262 | Tragic 95.2% |
| West Indians | 0.5 /100 | #263 | Tragic 95.2% |
| Immigrants | Nigeria | 0.4 /100 | #264 | Tragic 95.2% |
| Immigrants | Uruguay | 0.3 /100 | #265 | Tragic 95.2% |
| Immigrants | Ghana | 0.3 /100 | #266 | Tragic 95.2% |
Demographics Similar to Mexicans by 7th Grade
In terms of 7th grade, the demographic groups most similar to Mexicans are Yakama (91.7%, a difference of 0.20%), Guatemalan (91.7%, a difference of 0.21%), Central American (92.1%, a difference of 0.25%), Immigrants from Latin America (92.2%, a difference of 0.38%), and Salvadoran (91.5%, a difference of 0.49%).
| Demographics | Rating | Rank | 7th Grade |
| Hispanics or Latinos | 0.0 /100 | #332 | Tragic 92.7% |
| Immigrants | Armenia | 0.0 /100 | #333 | Tragic 92.7% |
| Immigrants | Yemen | 0.0 /100 | #334 | Tragic 92.6% |
| Mexican American Indians | 0.0 /100 | #335 | Tragic 92.6% |
| Immigrants | Honduras | 0.0 /100 | #336 | Tragic 92.5% |
| Immigrants | Latin America | 0.0 /100 | #337 | Tragic 92.2% |
| Central Americans | 0.0 /100 | #338 | Tragic 92.1% |
| Mexicans | 0.0 /100 | #339 | Tragic 91.9% |
| Yakama | 0.0 /100 | #340 | Tragic 91.7% |
| Guatemalans | 0.0 /100 | #341 | Tragic 91.7% |
| Salvadorans | 0.0 /100 | #342 | Tragic 91.5% |
| Immigrants | Guatemala | 0.0 /100 | #343 | Tragic 91.3% |
| Immigrants | Central America | 0.0 /100 | #344 | Tragic 91.0% |
| Immigrants | El Salvador | 0.0 /100 | #345 | Tragic 90.9% |
| Immigrants | Mexico | 0.0 /100 | #346 | Tragic 90.7% |