Immigrants from Costa Rica vs Romanian 6th Grade
COMPARE
Immigrants from Costa Rica
Romanian
6th Grade
6th Grade Comparison
Immigrants from Costa Rica
Romanians
96.6%
6TH GRADE
1.3/ 100
METRIC RATING
245th/ 347
METRIC RANK
97.5%
6TH GRADE
98.7/ 100
METRIC RATING
92nd/ 347
METRIC RANK
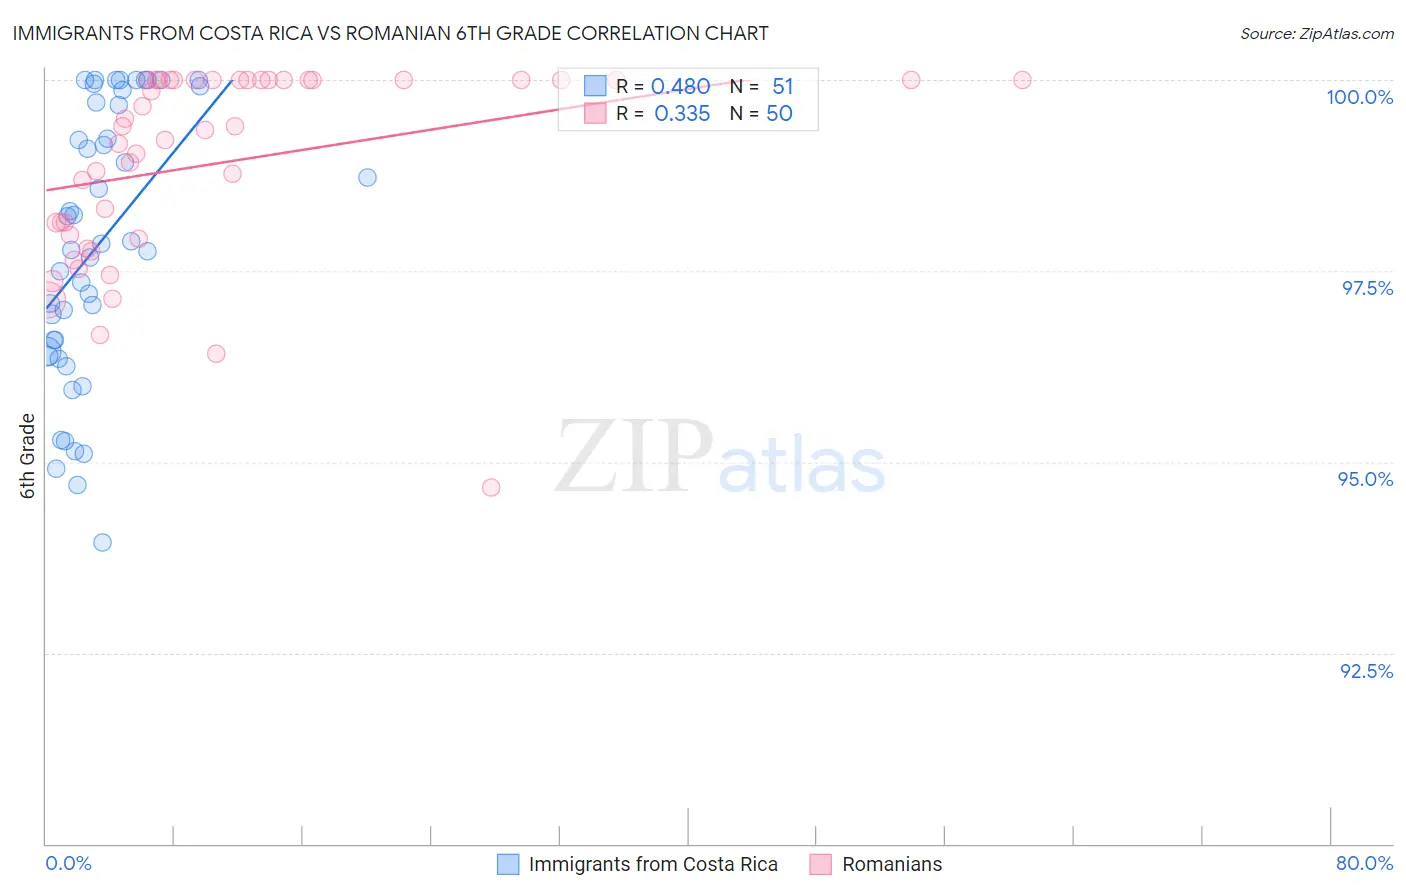
Immigrants from Costa Rica vs Romanian 6th Grade Correlation Chart
The statistical analysis conducted on geographies consisting of 204,275,869 people shows a moderate positive correlation between the proportion of Immigrants from Costa Rica and percentage of population with at least 6th grade education in the United States with a correlation coefficient (R) of 0.480 and weighted average of 96.6%. Similarly, the statistical analysis conducted on geographies consisting of 377,904,438 people shows a mild positive correlation between the proportion of Romanians and percentage of population with at least 6th grade education in the United States with a correlation coefficient (R) of 0.335 and weighted average of 97.5%, a difference of 1.0%.
6th Grade Correlation Summary
| Measurement | Immigrants from Costa Rica | Romanian |
| Minimum | 93.9% | 94.7% |
| Maximum | 100.0% | 100.0% |
| Range | 6.1% | 5.3% |
| Mean | 97.9% | 98.9% |
| Median | 97.9% | 99.4% |
| Interquartile 25% (IQ1) | 96.4% | 98.0% |
| Interquartile 75% (IQ3) | 99.7% | 100.0% |
| Interquartile Range (IQR) | 3.3% | 2.0% |
| Standard Deviation (Sample) | 1.8% | 1.3% |
| Standard Deviation (Population) | 1.7% | 1.2% |
Similar Demographics by 6th Grade
Demographics Similar to Immigrants from Costa Rica by 6th Grade
In terms of 6th grade, the demographic groups most similar to Immigrants from Costa Rica are Immigrants from Africa (96.6%, a difference of 0.0%), Ethiopian (96.6%, a difference of 0.020%), Immigrants from Liberia (96.6%, a difference of 0.030%), Bolivian (96.5%, a difference of 0.030%), and Nigerian (96.6%, a difference of 0.040%).
| Demographics | Rating | Rank | 6th Grade |
| Nigerians | 1.9 /100 | #238 | Tragic 96.6% |
| Indians (Asian) | 1.9 /100 | #239 | Tragic 96.6% |
| Koreans | 1.9 /100 | #240 | Tragic 96.6% |
| Senegalese | 1.8 /100 | #241 | Tragic 96.6% |
| Immigrants | Asia | 1.8 /100 | #242 | Tragic 96.6% |
| Immigrants | Liberia | 1.6 /100 | #243 | Tragic 96.6% |
| Ethiopians | 1.5 /100 | #244 | Tragic 96.6% |
| Immigrants | Costa Rica | 1.3 /100 | #245 | Tragic 96.6% |
| Immigrants | Africa | 1.3 /100 | #246 | Tragic 96.6% |
| Bolivians | 1.0 /100 | #247 | Tragic 96.5% |
| Tohono O'odham | 1.0 /100 | #248 | Tragic 96.5% |
| Colombians | 0.9 /100 | #249 | Tragic 96.5% |
| Immigrants | Middle Africa | 0.8 /100 | #250 | Tragic 96.5% |
| Immigrants | Senegal | 0.7 /100 | #251 | Tragic 96.5% |
| Immigrants | Uruguay | 0.6 /100 | #252 | Tragic 96.5% |
Demographics Similar to Romanians by 6th Grade
In terms of 6th grade, the demographic groups most similar to Romanians are Cree (97.5%, a difference of 0.0%), Cypriot (97.5%, a difference of 0.0%), Immigrants from Ireland (97.5%, a difference of 0.0%), Immigrants from South Africa (97.5%, a difference of 0.010%), and Immigrants from Australia (97.5%, a difference of 0.010%).
| Demographics | Rating | Rank | 6th Grade |
| Delaware | 98.9 /100 | #85 | Exceptional 97.6% |
| Immigrants | Belgium | 98.9 /100 | #86 | Exceptional 97.5% |
| Puget Sound Salish | 98.9 /100 | #87 | Exceptional 97.5% |
| Immigrants | South Africa | 98.9 /100 | #88 | Exceptional 97.5% |
| Immigrants | Australia | 98.8 /100 | #89 | Exceptional 97.5% |
| Pueblo | 98.8 /100 | #90 | Exceptional 97.5% |
| Immigrants | Western Europe | 98.8 /100 | #91 | Exceptional 97.5% |
| Romanians | 98.7 /100 | #92 | Exceptional 97.5% |
| Cree | 98.7 /100 | #93 | Exceptional 97.5% |
| Cypriots | 98.7 /100 | #94 | Exceptional 97.5% |
| Immigrants | Ireland | 98.7 /100 | #95 | Exceptional 97.5% |
| Immigrants | Germany | 98.6 /100 | #96 | Exceptional 97.5% |
| Immigrants | Sweden | 98.6 /100 | #97 | Exceptional 97.5% |
| Immigrants | Denmark | 98.5 /100 | #98 | Exceptional 97.5% |
| Yugoslavians | 98.5 /100 | #99 | Exceptional 97.5% |