German Russian vs Albanian Doctorate Degree
COMPARE
German Russian
Albanian
Doctorate Degree
Doctorate Degree Comparison
German Russians
Albanians
1.8%
DOCTORATE DEGREE
27.1/ 100
METRIC RATING
193rd/ 347
METRIC RANK
1.9%
DOCTORATE DEGREE
74.8/ 100
METRIC RATING
151st/ 347
METRIC RANK
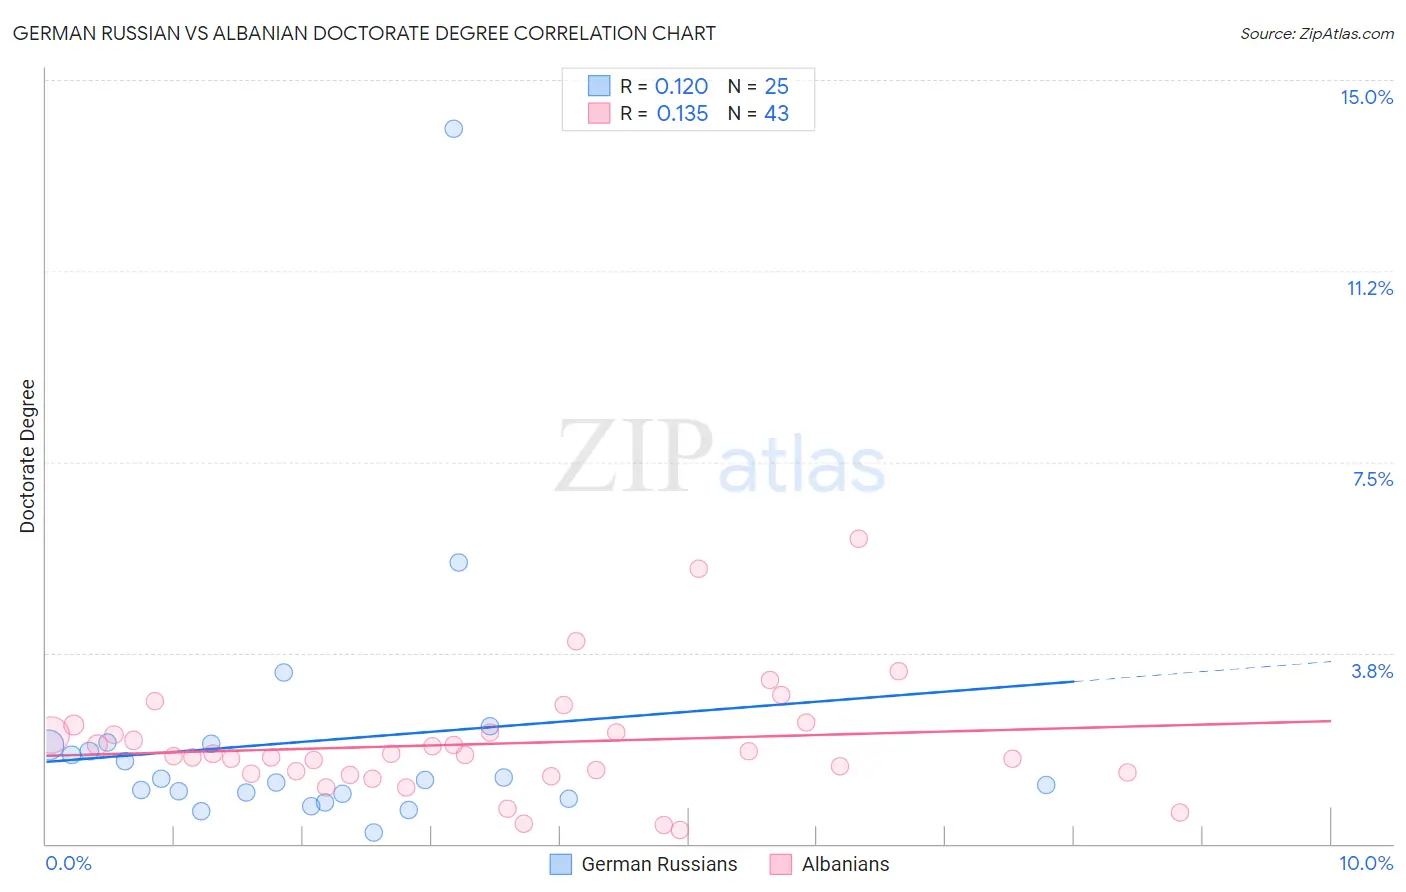
German Russian vs Albanian Doctorate Degree Correlation Chart
The statistical analysis conducted on geographies consisting of 96,106,122 people shows a poor positive correlation between the proportion of German Russians and percentage of population with at least doctorate degree education in the United States with a correlation coefficient (R) of 0.120 and weighted average of 1.8%. Similarly, the statistical analysis conducted on geographies consisting of 192,567,939 people shows a poor positive correlation between the proportion of Albanians and percentage of population with at least doctorate degree education in the United States with a correlation coefficient (R) of 0.135 and weighted average of 1.9%, a difference of 7.9%.
Doctorate Degree Correlation Summary
| Measurement | German Russian | Albanian |
| Minimum | 0.22% | 0.26% |
| Maximum | 14.0% | 6.0% |
| Range | 13.8% | 5.7% |
| Mean | 2.0% | 2.0% |
| Median | 1.3% | 1.7% |
| Interquartile 25% (IQ1) | 0.92% | 1.4% |
| Interquartile 75% (IQ3) | 1.9% | 2.2% |
| Interquartile Range (IQR) | 1.0% | 0.81% |
| Standard Deviation (Sample) | 2.7% | 1.1% |
| Standard Deviation (Population) | 2.7% | 1.1% |
Similar Demographics by Doctorate Degree
Demographics Similar to German Russians by Doctorate Degree
In terms of doctorate degree, the demographic groups most similar to German Russians are Dutch (1.8%, a difference of 0.070%), Uruguayan (1.8%, a difference of 0.17%), Immigrants from Somalia (1.8%, a difference of 0.33%), Subsaharan African (1.8%, a difference of 0.40%), and Chinese (1.8%, a difference of 0.40%).
| Demographics | Rating | Rank | Doctorate Degree |
| Peruvians | 34.4 /100 | #186 | Fair 1.8% |
| Czechoslovakians | 33.0 /100 | #187 | Fair 1.8% |
| Germans | 30.5 /100 | #188 | Fair 1.8% |
| French Canadians | 30.2 /100 | #189 | Fair 1.8% |
| Immigrants | Costa Rica | 30.2 /100 | #190 | Fair 1.8% |
| South Americans | 29.5 /100 | #191 | Fair 1.8% |
| Dutch | 27.4 /100 | #192 | Fair 1.8% |
| German Russians | 27.1 /100 | #193 | Fair 1.8% |
| Uruguayans | 26.2 /100 | #194 | Fair 1.8% |
| Immigrants | Somalia | 25.4 /100 | #195 | Fair 1.8% |
| Sub-Saharan Africans | 25.1 /100 | #196 | Fair 1.8% |
| Chinese | 25.1 /100 | #197 | Fair 1.8% |
| Immigrants | Ghana | 24.6 /100 | #198 | Fair 1.8% |
| Immigrants | South America | 23.3 /100 | #199 | Fair 1.8% |
| Whites/Caucasians | 22.8 /100 | #200 | Fair 1.8% |
Demographics Similar to Albanians by Doctorate Degree
In terms of doctorate degree, the demographic groups most similar to Albanians are Immigrants from Kenya (1.9%, a difference of 0.10%), Immigrants from Oceania (1.9%, a difference of 0.15%), English (1.9%, a difference of 0.19%), Immigrants from Albania (1.9%, a difference of 0.37%), and Polish (1.9%, a difference of 0.39%).
| Demographics | Rating | Rank | Doctorate Degree |
| Immigrants | Moldova | 84.3 /100 | #144 | Excellent 2.0% |
| Kenyans | 83.6 /100 | #145 | Excellent 1.9% |
| Immigrants | Syria | 83.6 /100 | #146 | Excellent 1.9% |
| Immigrants | Senegal | 82.5 /100 | #147 | Excellent 1.9% |
| Luxembourgers | 81.1 /100 | #148 | Excellent 1.9% |
| Basques | 76.9 /100 | #149 | Good 1.9% |
| English | 75.9 /100 | #150 | Good 1.9% |
| Albanians | 74.8 /100 | #151 | Good 1.9% |
| Immigrants | Kenya | 74.3 /100 | #152 | Good 1.9% |
| Immigrants | Oceania | 74.0 /100 | #153 | Good 1.9% |
| Immigrants | Albania | 72.8 /100 | #154 | Good 1.9% |
| Poles | 72.7 /100 | #155 | Good 1.9% |
| Slavs | 72.4 /100 | #156 | Good 1.9% |
| Danes | 71.9 /100 | #157 | Good 1.9% |
| Hungarians | 71.7 /100 | #158 | Good 1.9% |