Immigrants from Congo vs Immigrants from Eastern Asia 1st Grade
COMPARE
Immigrants from Congo
Immigrants from Eastern Asia
1st Grade
1st Grade Comparison
Immigrants from Congo
Immigrants from Eastern Asia
97.5%
1ST GRADE
0.7/ 100
METRIC RATING
253rd/ 347
METRIC RANK
97.6%
1ST GRADE
1.6/ 100
METRIC RATING
239th/ 347
METRIC RANK
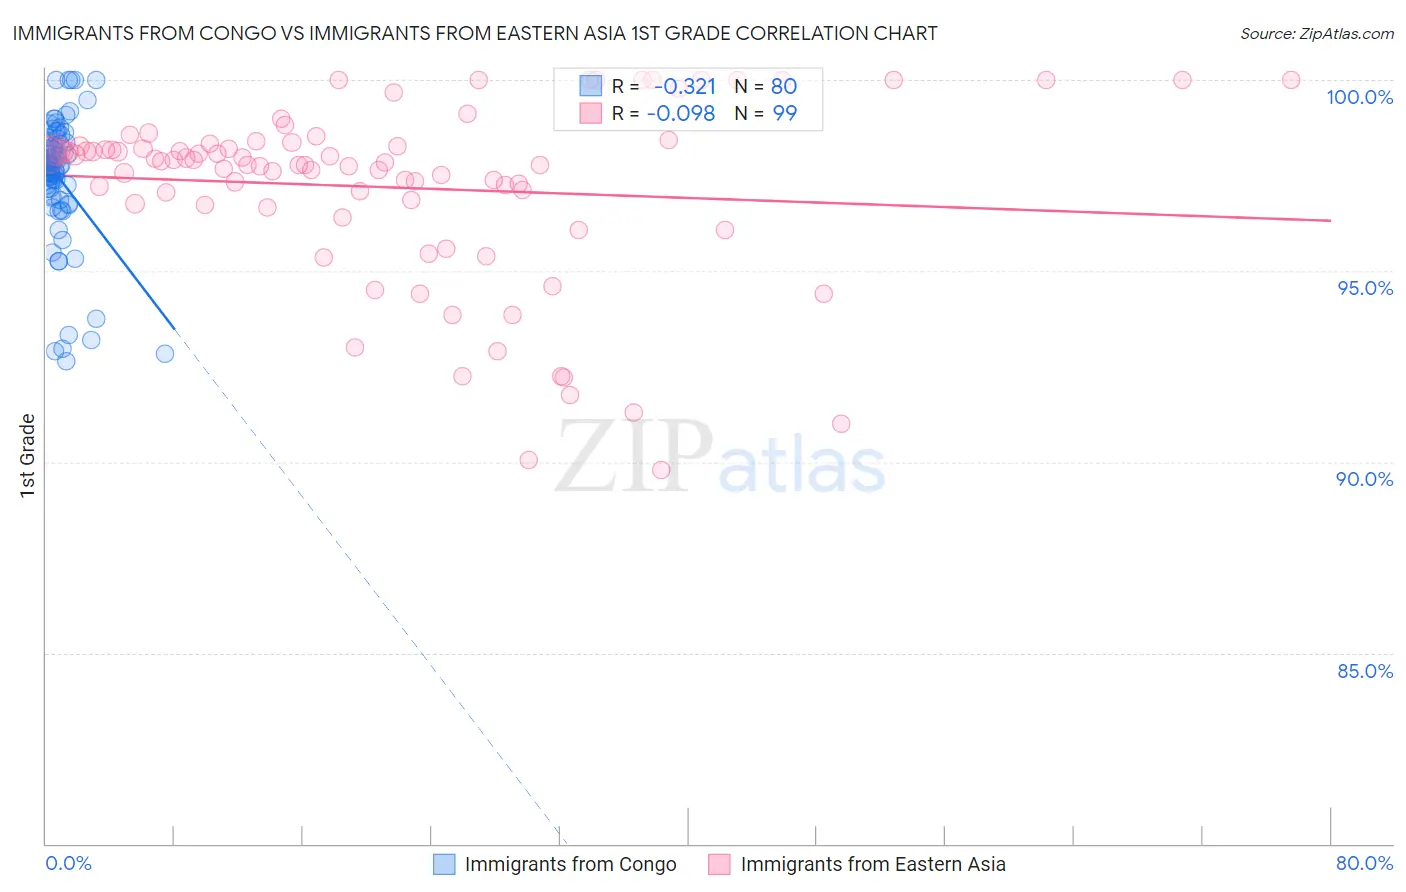
Immigrants from Congo vs Immigrants from Eastern Asia 1st Grade Correlation Chart
The statistical analysis conducted on geographies consisting of 92,124,753 people shows a mild negative correlation between the proportion of Immigrants from Congo and percentage of population with at least 1st grade education in the United States with a correlation coefficient (R) of -0.321 and weighted average of 97.5%. Similarly, the statistical analysis conducted on geographies consisting of 499,865,893 people shows a slight negative correlation between the proportion of Immigrants from Eastern Asia and percentage of population with at least 1st grade education in the United States with a correlation coefficient (R) of -0.098 and weighted average of 97.6%, a difference of 0.060%.
1st Grade Correlation Summary
| Measurement | Immigrants from Congo | Immigrants from Eastern Asia |
| Minimum | 92.6% | 89.8% |
| Maximum | 100.0% | 100.0% |
| Range | 7.4% | 10.2% |
| Mean | 97.4% | 97.2% |
| Median | 97.7% | 97.8% |
| Interquartile 25% (IQ1) | 96.9% | 96.7% |
| Interquartile 75% (IQ3) | 98.4% | 98.3% |
| Interquartile Range (IQR) | 1.5% | 1.6% |
| Standard Deviation (Sample) | 1.7% | 2.4% |
| Standard Deviation (Population) | 1.7% | 2.3% |
Demographics Similar to Immigrants from Congo and Immigrants from Eastern Asia by 1st Grade
In terms of 1st grade, the demographic groups most similar to Immigrants from Congo are Immigrants from Asia (97.5%, a difference of 0.0%), Immigrants from Africa (97.6%, a difference of 0.010%), Immigrants from Colombia (97.5%, a difference of 0.010%), Jamaican (97.5%, a difference of 0.010%), and Ethiopian (97.6%, a difference of 0.020%). Similarly, the demographic groups most similar to Immigrants from Eastern Asia are Korean (97.6%, a difference of 0.0%), U.S. Virgin Islander (97.6%, a difference of 0.010%), Nigerian (97.6%, a difference of 0.010%), Liberian (97.6%, a difference of 0.010%), and Immigrants from Western Asia (97.6%, a difference of 0.020%).
| Demographics | Rating | Rank | 1st Grade |
| Immigrants | Western Asia | 2.1 /100 | #236 | Tragic 97.6% |
| U.S. Virgin Islanders | 1.9 /100 | #237 | Tragic 97.6% |
| Nigerians | 1.8 /100 | #238 | Tragic 97.6% |
| Immigrants | Eastern Asia | 1.6 /100 | #239 | Tragic 97.6% |
| Koreans | 1.5 /100 | #240 | Tragic 97.6% |
| Liberians | 1.4 /100 | #241 | Tragic 97.6% |
| Immigrants | Indonesia | 1.2 /100 | #242 | Tragic 97.6% |
| Bolivians | 1.2 /100 | #243 | Tragic 97.6% |
| Asians | 1.1 /100 | #244 | Tragic 97.6% |
| South Americans | 1.1 /100 | #245 | Tragic 97.6% |
| Immigrants | Eastern Africa | 1.0 /100 | #246 | Tragic 97.6% |
| Peruvians | 1.0 /100 | #247 | Tragic 97.6% |
| Immigrants | Middle Africa | 1.0 /100 | #248 | Tragic 97.6% |
| Immigrants | Senegal | 1.0 /100 | #249 | Tragic 97.6% |
| Ethiopians | 0.9 /100 | #250 | Tragic 97.6% |
| Immigrants | Iraq | 0.9 /100 | #251 | Tragic 97.6% |
| Immigrants | Africa | 0.9 /100 | #252 | Tragic 97.6% |
| Immigrants | Congo | 0.7 /100 | #253 | Tragic 97.5% |
| Immigrants | Asia | 0.7 /100 | #254 | Tragic 97.5% |
| Immigrants | Colombia | 0.6 /100 | #255 | Tragic 97.5% |
| Jamaicans | 0.6 /100 | #256 | Tragic 97.5% |