Immigrants from Congo vs Scandinavian 6th Grade
COMPARE
Immigrants from Congo
Scandinavian
6th Grade
6th Grade Comparison
Immigrants from Congo
Scandinavians
96.5%
6TH GRADE
0.6/ 100
METRIC RATING
255th/ 347
METRIC RANK
98.0%
6TH GRADE
100.0/ 100
METRIC RATING
28th/ 347
METRIC RANK
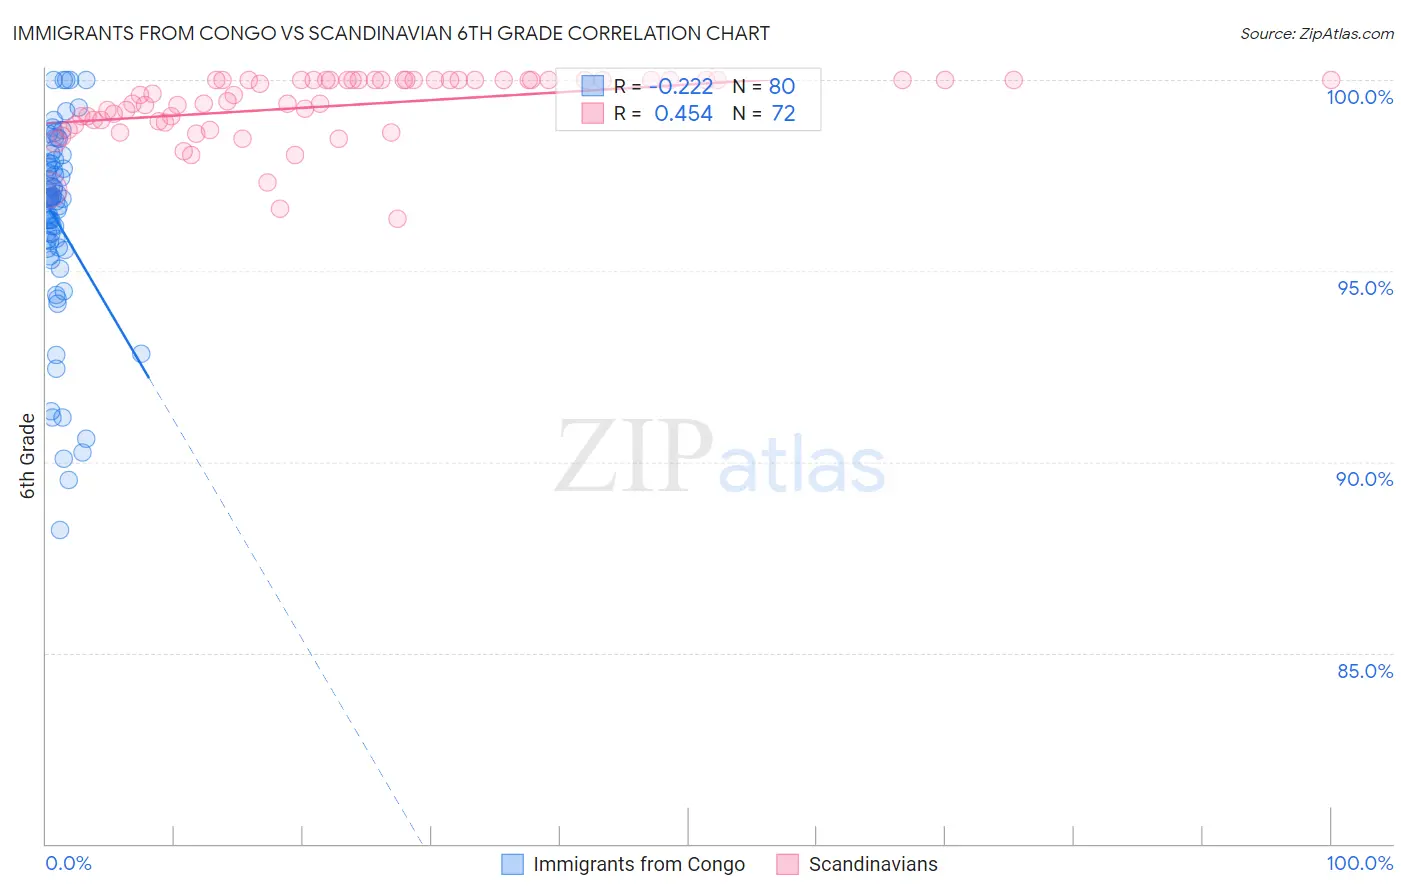
Immigrants from Congo vs Scandinavian 6th Grade Correlation Chart
The statistical analysis conducted on geographies consisting of 92,124,753 people shows a weak negative correlation between the proportion of Immigrants from Congo and percentage of population with at least 6th grade education in the United States with a correlation coefficient (R) of -0.222 and weighted average of 96.5%. Similarly, the statistical analysis conducted on geographies consisting of 472,660,325 people shows a moderate positive correlation between the proportion of Scandinavians and percentage of population with at least 6th grade education in the United States with a correlation coefficient (R) of 0.454 and weighted average of 98.0%, a difference of 1.6%.
6th Grade Correlation Summary
| Measurement | Immigrants from Congo | Scandinavian |
| Minimum | 88.2% | 96.4% |
| Maximum | 100.0% | 100.0% |
| Range | 11.8% | 3.6% |
| Mean | 96.3% | 99.3% |
| Median | 96.9% | 99.6% |
| Interquartile 25% (IQ1) | 95.6% | 98.9% |
| Interquartile 75% (IQ3) | 97.8% | 100.0% |
| Interquartile Range (IQR) | 2.2% | 1.1% |
| Standard Deviation (Sample) | 2.6% | 0.85% |
| Standard Deviation (Population) | 2.6% | 0.85% |
Similar Demographics by 6th Grade
Demographics Similar to Immigrants from Congo by 6th Grade
In terms of 6th grade, the demographic groups most similar to Immigrants from Congo are Immigrants from Ethiopia (96.5%, a difference of 0.0%), Immigrants from Uruguay (96.5%, a difference of 0.010%), Jamaican (96.5%, a difference of 0.010%), U.S. Virgin Islander (96.5%, a difference of 0.010%), and Immigrants from Senegal (96.5%, a difference of 0.020%).
| Demographics | Rating | Rank | 6th Grade |
| Tohono O'odham | 1.0 /100 | #248 | Tragic 96.5% |
| Colombians | 0.9 /100 | #249 | Tragic 96.5% |
| Immigrants | Middle Africa | 0.8 /100 | #250 | Tragic 96.5% |
| Immigrants | Senegal | 0.7 /100 | #251 | Tragic 96.5% |
| Immigrants | Uruguay | 0.6 /100 | #252 | Tragic 96.5% |
| Jamaicans | 0.6 /100 | #253 | Tragic 96.5% |
| Immigrants | Ethiopia | 0.6 /100 | #254 | Tragic 96.5% |
| Immigrants | Congo | 0.6 /100 | #255 | Tragic 96.5% |
| U.S. Virgin Islanders | 0.5 /100 | #256 | Tragic 96.5% |
| Taiwanese | 0.5 /100 | #257 | Tragic 96.5% |
| Immigrants | China | 0.4 /100 | #258 | Tragic 96.4% |
| South Americans | 0.4 /100 | #259 | Tragic 96.4% |
| Peruvians | 0.4 /100 | #260 | Tragic 96.4% |
| Immigrants | Sierra Leone | 0.4 /100 | #261 | Tragic 96.4% |
| Immigrants | Nigeria | 0.3 /100 | #262 | Tragic 96.4% |
Demographics Similar to Scandinavians by 6th Grade
In terms of 6th grade, the demographic groups most similar to Scandinavians are Czech (98.0%, a difference of 0.0%), Yup'ik (98.0%, a difference of 0.0%), French (98.0%, a difference of 0.0%), French Canadian (98.0%, a difference of 0.010%), and European (98.0%, a difference of 0.010%).
| Demographics | Rating | Rank | 6th Grade |
| Lithuanians | 100.0 /100 | #21 | Exceptional 98.1% |
| Danes | 100.0 /100 | #22 | Exceptional 98.0% |
| Sioux | 100.0 /100 | #23 | Exceptional 98.0% |
| Croatians | 100.0 /100 | #24 | Exceptional 98.0% |
| Scotch-Irish | 100.0 /100 | #25 | Exceptional 98.0% |
| Czechs | 100.0 /100 | #26 | Exceptional 98.0% |
| Yup'ik | 100.0 /100 | #27 | Exceptional 98.0% |
| Scandinavians | 100.0 /100 | #28 | Exceptional 98.0% |
| French | 100.0 /100 | #29 | Exceptional 98.0% |
| French Canadians | 100.0 /100 | #30 | Exceptional 98.0% |
| Europeans | 100.0 /100 | #31 | Exceptional 98.0% |
| Alaska Natives | 100.0 /100 | #32 | Exceptional 98.0% |
| Chippewa | 100.0 /100 | #33 | Exceptional 97.9% |
| Swiss | 100.0 /100 | #34 | Exceptional 97.9% |
| Chinese | 100.0 /100 | #35 | Exceptional 97.9% |