Immigrants from China vs Marshallese Doctorate Degree
COMPARE
Immigrants from China
Marshallese
Doctorate Degree
Doctorate Degree Comparison
Immigrants from China
Marshallese
3.1%
DOCTORATE DEGREE
100.0/ 100
METRIC RATING
7th/ 347
METRIC RANK
1.5%
DOCTORATE DEGREE
0.4/ 100
METRIC RATING
279th/ 347
METRIC RANK
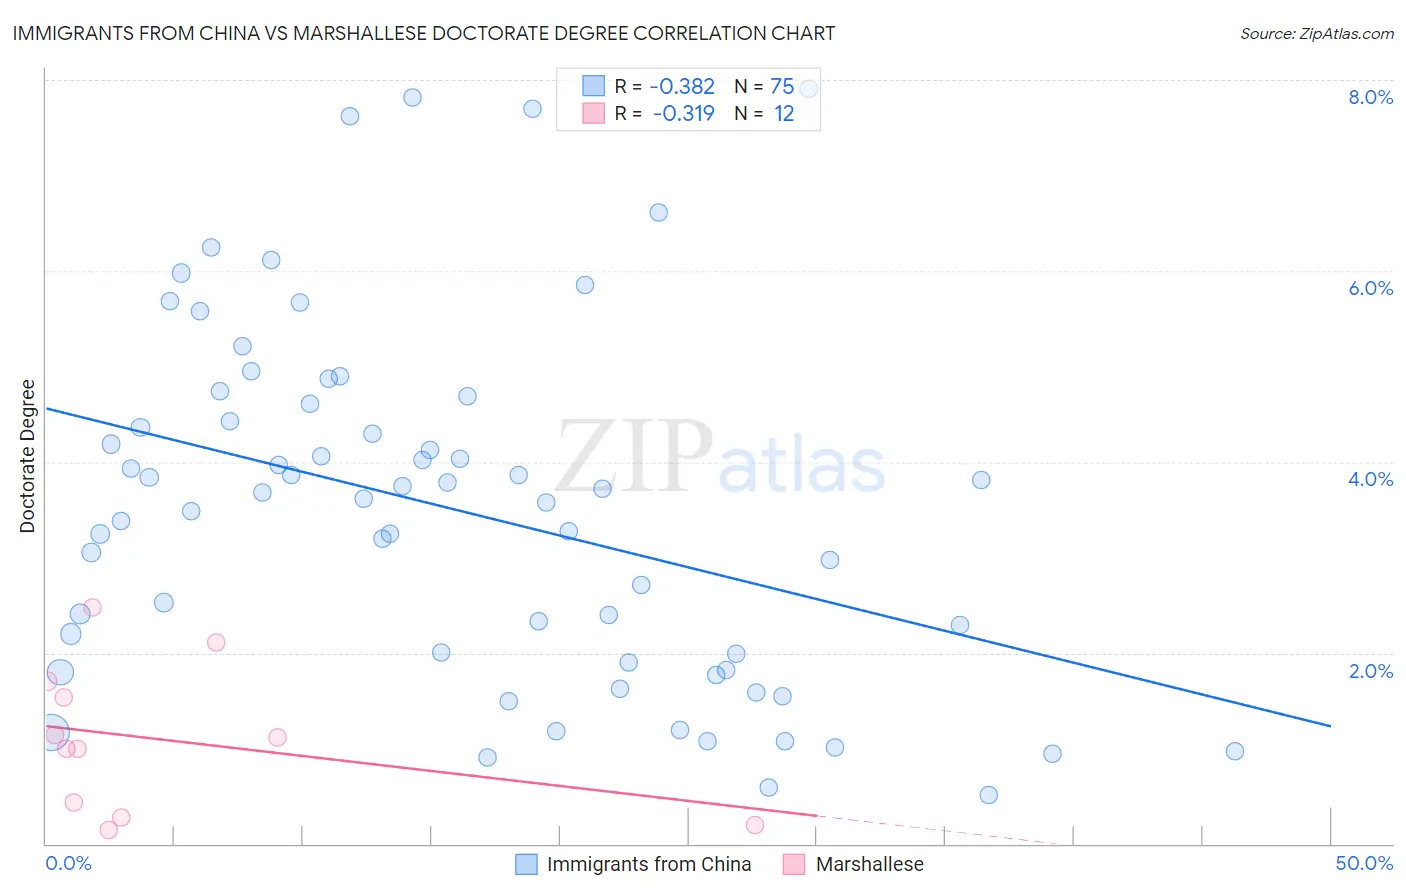
Immigrants from China vs Marshallese Doctorate Degree Correlation Chart
The statistical analysis conducted on geographies consisting of 452,322,361 people shows a mild negative correlation between the proportion of Immigrants from China and percentage of population with at least doctorate degree education in the United States with a correlation coefficient (R) of -0.382 and weighted average of 3.1%. Similarly, the statistical analysis conducted on geographies consisting of 14,742,598 people shows a mild negative correlation between the proportion of Marshallese and percentage of population with at least doctorate degree education in the United States with a correlation coefficient (R) of -0.319 and weighted average of 1.5%, a difference of 111.6%.
Doctorate Degree Correlation Summary
| Measurement | Immigrants from China | Marshallese |
| Minimum | 0.51% | 0.14% |
| Maximum | 7.9% | 2.5% |
| Range | 7.4% | 2.3% |
| Mean | 3.5% | 1.1% |
| Median | 3.6% | 1.1% |
| Interquartile 25% (IQ1) | 1.9% | 0.35% |
| Interquartile 75% (IQ3) | 4.6% | 1.6% |
| Interquartile Range (IQR) | 2.7% | 1.3% |
| Standard Deviation (Sample) | 1.8% | 0.76% |
| Standard Deviation (Population) | 1.8% | 0.73% |
Similar Demographics by Doctorate Degree
Demographics Similar to Immigrants from China by Doctorate Degree
In terms of doctorate degree, the demographic groups most similar to Immigrants from China are Immigrants from Switzerland (3.1%, a difference of 0.070%), Immigrants from Israel (3.0%, a difference of 1.3%), Iranian (3.1%, a difference of 2.0%), Immigrants from Iran (3.0%, a difference of 2.0%), and Immigrants from Taiwan (3.2%, a difference of 3.6%).
| Demographics | Rating | Rank | Doctorate Degree |
| Immigrants | Singapore | 100.0 /100 | #1 | Exceptional 3.7% |
| Filipinos | 100.0 /100 | #2 | Exceptional 3.4% |
| Okinawans | 100.0 /100 | #3 | Exceptional 3.3% |
| Immigrants | Taiwan | 100.0 /100 | #4 | Exceptional 3.2% |
| Iranians | 100.0 /100 | #5 | Exceptional 3.1% |
| Immigrants | Switzerland | 100.0 /100 | #6 | Exceptional 3.1% |
| Immigrants | China | 100.0 /100 | #7 | Exceptional 3.1% |
| Immigrants | Israel | 100.0 /100 | #8 | Exceptional 3.0% |
| Immigrants | Iran | 100.0 /100 | #9 | Exceptional 3.0% |
| Immigrants | Eastern Asia | 100.0 /100 | #10 | Exceptional 3.0% |
| Indians (Asian) | 100.0 /100 | #11 | Exceptional 2.9% |
| Immigrants | Belgium | 100.0 /100 | #12 | Exceptional 2.9% |
| Immigrants | Sweden | 100.0 /100 | #13 | Exceptional 2.9% |
| Immigrants | France | 100.0 /100 | #14 | Exceptional 2.9% |
| Immigrants | India | 100.0 /100 | #15 | Exceptional 2.8% |
Demographics Similar to Marshallese by Doctorate Degree
In terms of doctorate degree, the demographic groups most similar to Marshallese are Ecuadorian (1.5%, a difference of 0.010%), Tohono O'odham (1.5%, a difference of 0.080%), British West Indian (1.5%, a difference of 0.13%), Central American (1.5%, a difference of 0.18%), and Hawaiian (1.5%, a difference of 0.22%).
| Demographics | Rating | Rank | Doctorate Degree |
| Immigrants | Barbados | 0.4 /100 | #272 | Tragic 1.5% |
| Sioux | 0.4 /100 | #273 | Tragic 1.5% |
| Yaqui | 0.4 /100 | #274 | Tragic 1.5% |
| Aleuts | 0.4 /100 | #275 | Tragic 1.5% |
| Paiute | 0.4 /100 | #276 | Tragic 1.5% |
| Bahamians | 0.4 /100 | #277 | Tragic 1.5% |
| Hawaiians | 0.4 /100 | #278 | Tragic 1.5% |
| Marshallese | 0.4 /100 | #279 | Tragic 1.5% |
| Ecuadorians | 0.4 /100 | #280 | Tragic 1.5% |
| Tohono O'odham | 0.4 /100 | #281 | Tragic 1.5% |
| British West Indians | 0.3 /100 | #282 | Tragic 1.5% |
| Central Americans | 0.3 /100 | #283 | Tragic 1.5% |
| Jamaicans | 0.3 /100 | #284 | Tragic 1.5% |
| Malaysians | 0.3 /100 | #285 | Tragic 1.5% |
| Cherokee | 0.3 /100 | #286 | Tragic 1.5% |