Immigrants from Latin America vs Marshallese Doctorate Degree
COMPARE
Immigrants from Latin America
Marshallese
Doctorate Degree
Doctorate Degree Comparison
Immigrants from Latin America
Marshallese
1.3%
DOCTORATE DEGREE
0.0/ 100
METRIC RATING
331st/ 347
METRIC RANK
1.5%
DOCTORATE DEGREE
0.4/ 100
METRIC RATING
279th/ 347
METRIC RANK
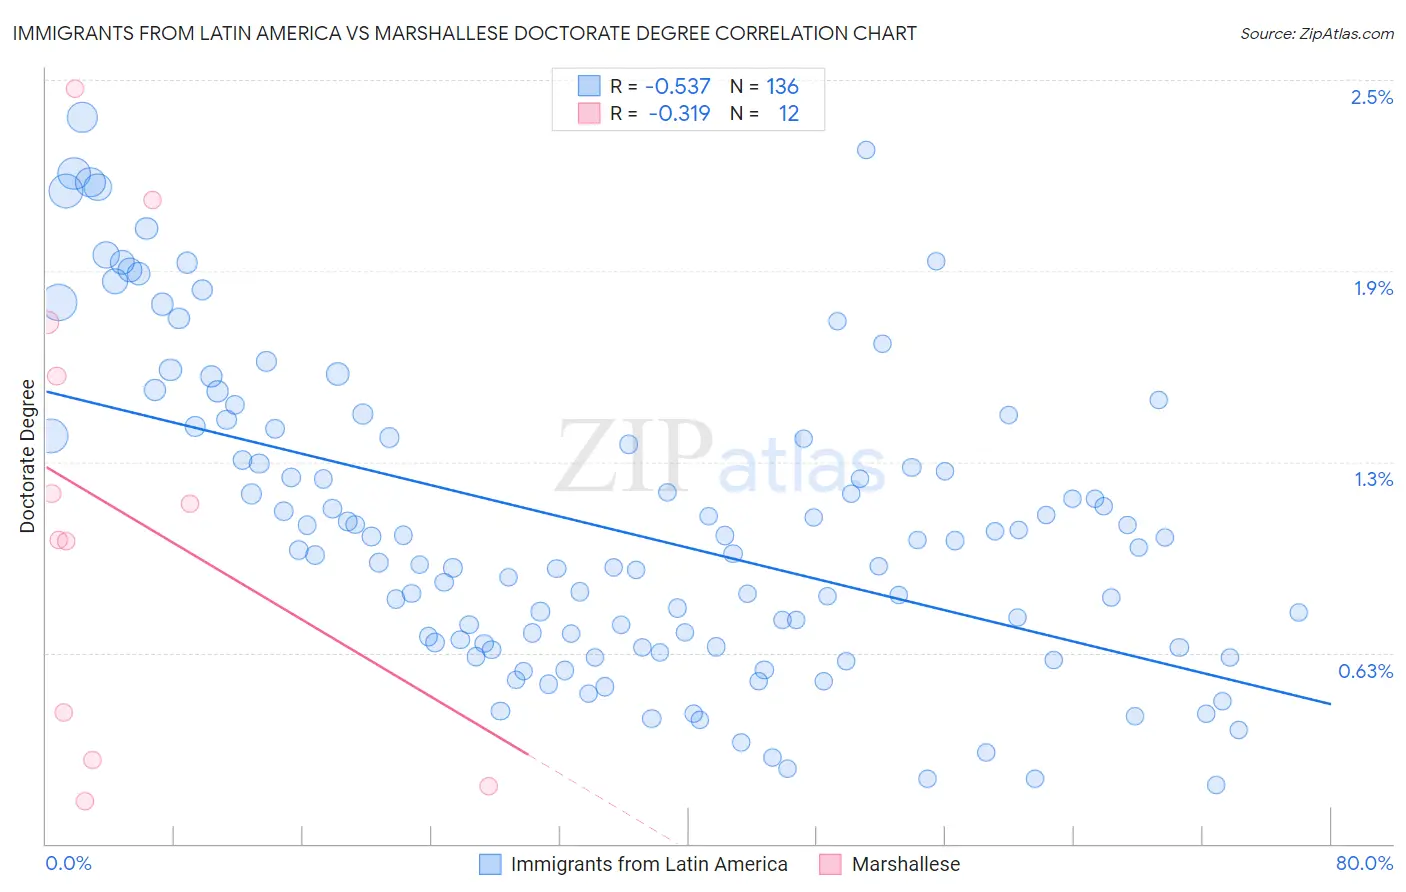
Immigrants from Latin America vs Marshallese Doctorate Degree Correlation Chart
The statistical analysis conducted on geographies consisting of 538,199,058 people shows a substantial negative correlation between the proportion of Immigrants from Latin America and percentage of population with at least doctorate degree education in the United States with a correlation coefficient (R) of -0.537 and weighted average of 1.3%. Similarly, the statistical analysis conducted on geographies consisting of 14,742,598 people shows a mild negative correlation between the proportion of Marshallese and percentage of population with at least doctorate degree education in the United States with a correlation coefficient (R) of -0.319 and weighted average of 1.5%, a difference of 11.9%.
Doctorate Degree Correlation Summary
| Measurement | Immigrants from Latin America | Marshallese |
| Minimum | 0.19% | 0.14% |
| Maximum | 2.4% | 2.5% |
| Range | 2.2% | 2.3% |
| Mean | 1.0% | 1.1% |
| Median | 0.97% | 1.1% |
| Interquartile 25% (IQ1) | 0.65% | 0.35% |
| Interquartile 75% (IQ3) | 1.3% | 1.6% |
| Interquartile Range (IQR) | 0.68% | 1.3% |
| Standard Deviation (Sample) | 0.50% | 0.76% |
| Standard Deviation (Population) | 0.50% | 0.73% |
Similar Demographics by Doctorate Degree
Demographics Similar to Immigrants from Latin America by Doctorate Degree
In terms of doctorate degree, the demographic groups most similar to Immigrants from Latin America are Yup'ik (1.3%, a difference of 0.010%), Haitian (1.3%, a difference of 0.23%), Inupiat (1.3%, a difference of 0.28%), Hispanic or Latino (1.3%, a difference of 0.86%), and Immigrants from Cabo Verde (1.3%, a difference of 1.1%).
| Demographics | Rating | Rank | Doctorate Degree |
| Natives/Alaskans | 0.0 /100 | #324 | Tragic 1.3% |
| Pima | 0.0 /100 | #325 | Tragic 1.3% |
| Immigrants | Cabo Verde | 0.0 /100 | #326 | Tragic 1.3% |
| Hispanics or Latinos | 0.0 /100 | #327 | Tragic 1.3% |
| Inupiat | 0.0 /100 | #328 | Tragic 1.3% |
| Haitians | 0.0 /100 | #329 | Tragic 1.3% |
| Yup'ik | 0.0 /100 | #330 | Tragic 1.3% |
| Immigrants | Latin America | 0.0 /100 | #331 | Tragic 1.3% |
| Yakama | 0.0 /100 | #332 | Tragic 1.3% |
| Immigrants | Caribbean | 0.0 /100 | #333 | Tragic 1.3% |
| Immigrants | Dominican Republic | 0.0 /100 | #334 | Tragic 1.3% |
| Immigrants | Haiti | 0.0 /100 | #335 | Tragic 1.3% |
| Nepalese | 0.0 /100 | #336 | Tragic 1.3% |
| Bangladeshis | 0.0 /100 | #337 | Tragic 1.2% |
| Puget Sound Salish | 0.0 /100 | #338 | Tragic 1.2% |
Demographics Similar to Marshallese by Doctorate Degree
In terms of doctorate degree, the demographic groups most similar to Marshallese are Ecuadorian (1.5%, a difference of 0.010%), Tohono O'odham (1.5%, a difference of 0.080%), British West Indian (1.5%, a difference of 0.13%), Central American (1.5%, a difference of 0.18%), and Hawaiian (1.5%, a difference of 0.22%).
| Demographics | Rating | Rank | Doctorate Degree |
| Immigrants | Barbados | 0.4 /100 | #272 | Tragic 1.5% |
| Sioux | 0.4 /100 | #273 | Tragic 1.5% |
| Yaqui | 0.4 /100 | #274 | Tragic 1.5% |
| Aleuts | 0.4 /100 | #275 | Tragic 1.5% |
| Paiute | 0.4 /100 | #276 | Tragic 1.5% |
| Bahamians | 0.4 /100 | #277 | Tragic 1.5% |
| Hawaiians | 0.4 /100 | #278 | Tragic 1.5% |
| Marshallese | 0.4 /100 | #279 | Tragic 1.5% |
| Ecuadorians | 0.4 /100 | #280 | Tragic 1.5% |
| Tohono O'odham | 0.4 /100 | #281 | Tragic 1.5% |
| British West Indians | 0.3 /100 | #282 | Tragic 1.5% |
| Central Americans | 0.3 /100 | #283 | Tragic 1.5% |
| Jamaicans | 0.3 /100 | #284 | Tragic 1.5% |
| Malaysians | 0.3 /100 | #285 | Tragic 1.5% |
| Cherokee | 0.3 /100 | #286 | Tragic 1.5% |