Immigrants from China vs Danish 7th Grade
COMPARE
Immigrants from China
Danish
7th Grade
7th Grade Comparison
Immigrants from China
Danes
95.3%
7TH GRADE
0.7/ 100
METRIC RATING
256th/ 347
METRIC RANK
97.4%
7TH GRADE
100.0/ 100
METRIC RATING
27th/ 347
METRIC RANK
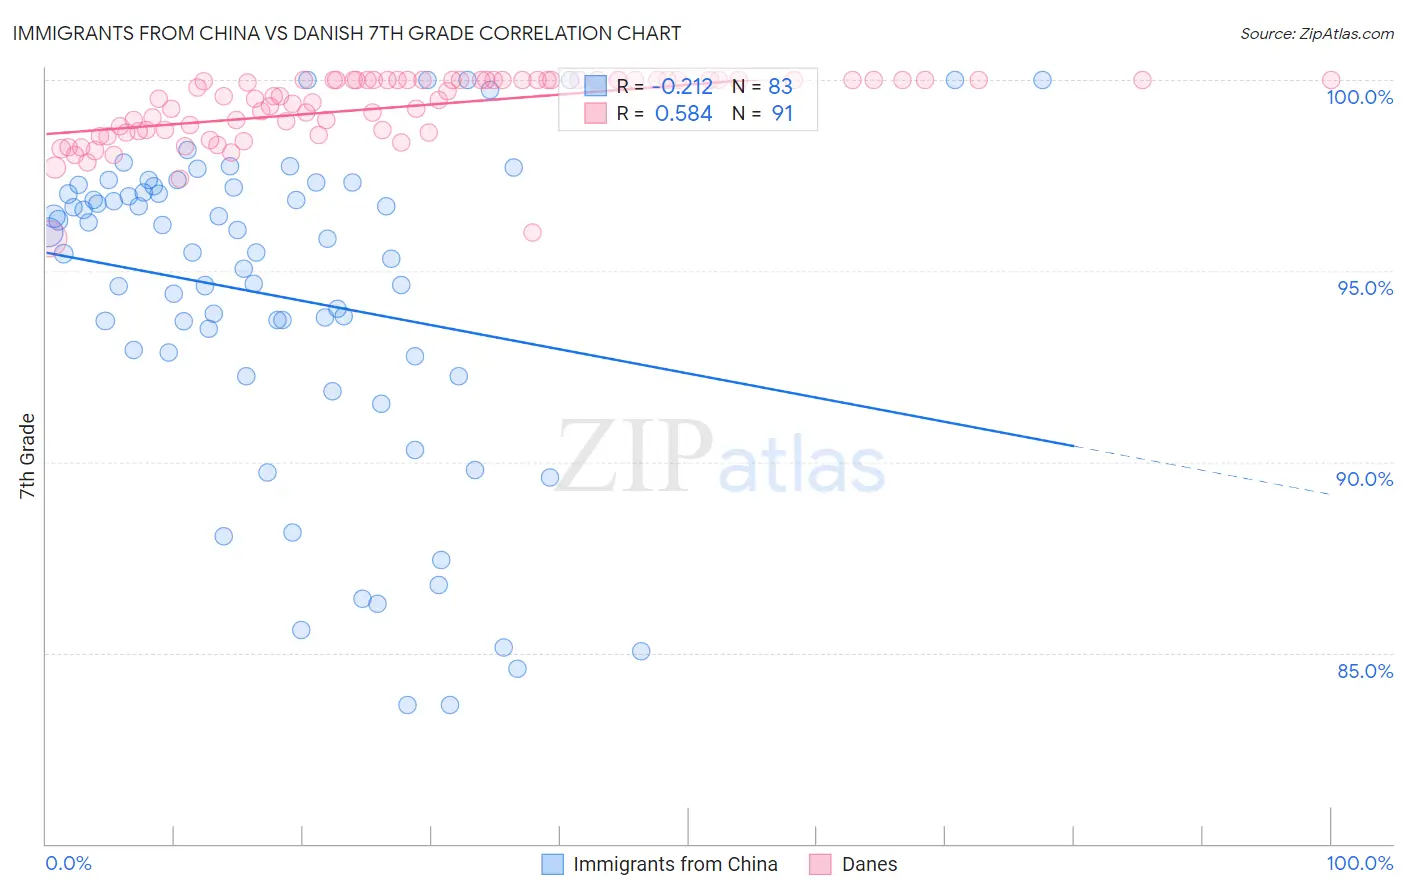
Immigrants from China vs Danish 7th Grade Correlation Chart
The statistical analysis conducted on geographies consisting of 457,082,957 people shows a weak negative correlation between the proportion of Immigrants from China and percentage of population with at least 7th grade education in the United States with a correlation coefficient (R) of -0.212 and weighted average of 95.3%. Similarly, the statistical analysis conducted on geographies consisting of 474,193,610 people shows a substantial positive correlation between the proportion of Danes and percentage of population with at least 7th grade education in the United States with a correlation coefficient (R) of 0.584 and weighted average of 97.4%, a difference of 2.2%.
7th Grade Correlation Summary
| Measurement | Immigrants from China | Danish |
| Minimum | 83.6% | 95.9% |
| Maximum | 100.0% | 100.0% |
| Range | 16.4% | 4.1% |
| Mean | 94.3% | 99.3% |
| Median | 95.5% | 99.6% |
| Interquartile 25% (IQ1) | 92.8% | 98.7% |
| Interquartile 75% (IQ3) | 97.2% | 100.0% |
| Interquartile Range (IQR) | 4.4% | 1.3% |
| Standard Deviation (Sample) | 4.2% | 0.89% |
| Standard Deviation (Population) | 4.2% | 0.89% |
Similar Demographics by 7th Grade
Demographics Similar to Immigrants from China by 7th Grade
In terms of 7th grade, the demographic groups most similar to Immigrants from China are Immigrants from Congo (95.3%, a difference of 0.0%), Ghanaian (95.3%, a difference of 0.0%), Korean (95.3%, a difference of 0.010%), Colombian (95.3%, a difference of 0.020%), and Immigrants from Ethiopia (95.3%, a difference of 0.030%).
| Demographics | Rating | Rank | 7th Grade |
| Bolivians | 1.1 /100 | #249 | Tragic 95.4% |
| Immigrants | Cameroon | 0.9 /100 | #250 | Tragic 95.4% |
| Immigrants | Jamaica | 0.9 /100 | #251 | Tragic 95.4% |
| Immigrants | Ethiopia | 0.9 /100 | #252 | Tragic 95.3% |
| Somalis | 0.9 /100 | #253 | Tragic 95.3% |
| Colombians | 0.8 /100 | #254 | Tragic 95.3% |
| Koreans | 0.8 /100 | #255 | Tragic 95.3% |
| Immigrants | China | 0.7 /100 | #256 | Tragic 95.3% |
| Immigrants | Congo | 0.7 /100 | #257 | Tragic 95.3% |
| Ghanaians | 0.7 /100 | #258 | Tragic 95.3% |
| Immigrants | Costa Rica | 0.6 /100 | #259 | Tragic 95.3% |
| Afghans | 0.5 /100 | #260 | Tragic 95.3% |
| South Americans | 0.5 /100 | #261 | Tragic 95.2% |
| Immigrants | Somalia | 0.5 /100 | #262 | Tragic 95.2% |
| West Indians | 0.5 /100 | #263 | Tragic 95.2% |
Demographics Similar to Danes by 7th Grade
In terms of 7th grade, the demographic groups most similar to Danes are Scotch-Irish (97.4%, a difference of 0.0%), Welsh (97.4%, a difference of 0.010%), French (97.4%, a difference of 0.010%), Croatian (97.4%, a difference of 0.020%), and Sioux (97.4%, a difference of 0.020%).
| Demographics | Rating | Rank | 7th Grade |
| Yup'ik | 100.0 /100 | #20 | Exceptional 97.4% |
| Inupiat | 100.0 /100 | #21 | Exceptional 97.4% |
| French Canadians | 100.0 /100 | #22 | Exceptional 97.4% |
| Croatians | 100.0 /100 | #23 | Exceptional 97.4% |
| Welsh | 100.0 /100 | #24 | Exceptional 97.4% |
| French | 100.0 /100 | #25 | Exceptional 97.4% |
| Scotch-Irish | 100.0 /100 | #26 | Exceptional 97.4% |
| Danes | 100.0 /100 | #27 | Exceptional 97.4% |
| Sioux | 100.0 /100 | #28 | Exceptional 97.4% |
| Scandinavians | 100.0 /100 | #29 | Exceptional 97.4% |
| Czechs | 100.0 /100 | #30 | Exceptional 97.4% |
| Europeans | 100.0 /100 | #31 | Exceptional 97.3% |
| Italians | 100.0 /100 | #32 | Exceptional 97.3% |
| Chippewa | 100.0 /100 | #33 | Exceptional 97.3% |
| Alaska Natives | 100.0 /100 | #34 | Exceptional 97.3% |