Immigrants from China vs Ukrainian 7th Grade
COMPARE
Immigrants from China
Ukrainian
7th Grade
7th Grade Comparison
Immigrants from China
Ukrainians
95.3%
7TH GRADE
0.7/ 100
METRIC RATING
256th/ 347
METRIC RANK
96.9%
7TH GRADE
99.7/ 100
METRIC RATING
66th/ 347
METRIC RANK
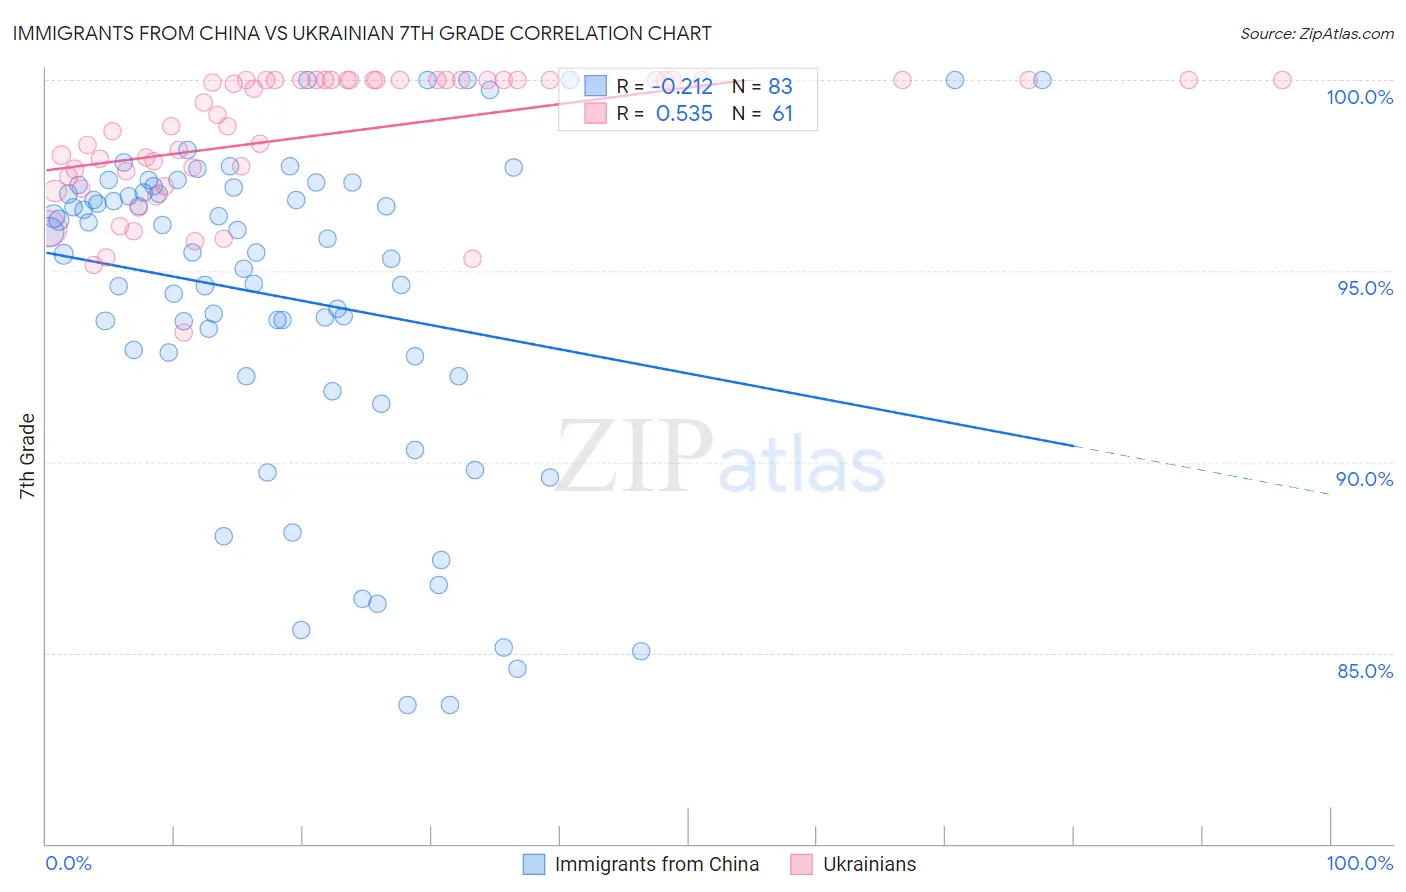
Immigrants from China vs Ukrainian 7th Grade Correlation Chart
The statistical analysis conducted on geographies consisting of 457,082,957 people shows a weak negative correlation between the proportion of Immigrants from China and percentage of population with at least 7th grade education in the United States with a correlation coefficient (R) of -0.212 and weighted average of 95.3%. Similarly, the statistical analysis conducted on geographies consisting of 448,697,146 people shows a substantial positive correlation between the proportion of Ukrainians and percentage of population with at least 7th grade education in the United States with a correlation coefficient (R) of 0.535 and weighted average of 96.9%, a difference of 1.7%.
7th Grade Correlation Summary
| Measurement | Immigrants from China | Ukrainian |
| Minimum | 83.6% | 93.4% |
| Maximum | 100.0% | 100.0% |
| Range | 16.4% | 6.6% |
| Mean | 94.3% | 98.6% |
| Median | 95.5% | 99.4% |
| Interquartile 25% (IQ1) | 92.8% | 97.5% |
| Interquartile 75% (IQ3) | 97.2% | 100.0% |
| Interquartile Range (IQR) | 4.4% | 2.5% |
| Standard Deviation (Sample) | 4.2% | 1.7% |
| Standard Deviation (Population) | 4.2% | 1.7% |
Similar Demographics by 7th Grade
Demographics Similar to Immigrants from China by 7th Grade
In terms of 7th grade, the demographic groups most similar to Immigrants from China are Immigrants from Congo (95.3%, a difference of 0.0%), Ghanaian (95.3%, a difference of 0.0%), Korean (95.3%, a difference of 0.010%), Colombian (95.3%, a difference of 0.020%), and Immigrants from Ethiopia (95.3%, a difference of 0.030%).
| Demographics | Rating | Rank | 7th Grade |
| Bolivians | 1.1 /100 | #249 | Tragic 95.4% |
| Immigrants | Cameroon | 0.9 /100 | #250 | Tragic 95.4% |
| Immigrants | Jamaica | 0.9 /100 | #251 | Tragic 95.4% |
| Immigrants | Ethiopia | 0.9 /100 | #252 | Tragic 95.3% |
| Somalis | 0.9 /100 | #253 | Tragic 95.3% |
| Colombians | 0.8 /100 | #254 | Tragic 95.3% |
| Koreans | 0.8 /100 | #255 | Tragic 95.3% |
| Immigrants | China | 0.7 /100 | #256 | Tragic 95.3% |
| Immigrants | Congo | 0.7 /100 | #257 | Tragic 95.3% |
| Ghanaians | 0.7 /100 | #258 | Tragic 95.3% |
| Immigrants | Costa Rica | 0.6 /100 | #259 | Tragic 95.3% |
| Afghans | 0.5 /100 | #260 | Tragic 95.3% |
| South Americans | 0.5 /100 | #261 | Tragic 95.2% |
| Immigrants | Somalia | 0.5 /100 | #262 | Tragic 95.2% |
| West Indians | 0.5 /100 | #263 | Tragic 95.2% |
Demographics Similar to Ukrainians by 7th Grade
In terms of 7th grade, the demographic groups most similar to Ukrainians are Native Hawaiian (96.9%, a difference of 0.0%), Immigrants from Austria (96.9%, a difference of 0.020%), Canadian (96.9%, a difference of 0.020%), Immigrants from India (96.9%, a difference of 0.020%), and Immigrants from Northern Europe (96.9%, a difference of 0.030%).
| Demographics | Rating | Rank | 7th Grade |
| Macedonians | 99.8 /100 | #59 | Exceptional 97.0% |
| Immigrants | Canada | 99.8 /100 | #60 | Exceptional 96.9% |
| Creek | 99.8 /100 | #61 | Exceptional 96.9% |
| Immigrants | North America | 99.8 /100 | #62 | Exceptional 96.9% |
| Immigrants | Northern Europe | 99.7 /100 | #63 | Exceptional 96.9% |
| Immigrants | Austria | 99.7 /100 | #64 | Exceptional 96.9% |
| Canadians | 99.7 /100 | #65 | Exceptional 96.9% |
| Ukrainians | 99.7 /100 | #66 | Exceptional 96.9% |
| Native Hawaiians | 99.7 /100 | #67 | Exceptional 96.9% |
| Immigrants | India | 99.6 /100 | #68 | Exceptional 96.9% |
| Iranians | 99.6 /100 | #69 | Exceptional 96.8% |
| New Zealanders | 99.6 /100 | #70 | Exceptional 96.8% |
| Immigrants | Lithuania | 99.6 /100 | #71 | Exceptional 96.8% |
| Cajuns | 99.5 /100 | #72 | Exceptional 96.8% |
| Arapaho | 99.5 /100 | #73 | Exceptional 96.8% |