Immigrants from Bolivia vs Chilean 6th Grade
COMPARE
Immigrants from Bolivia
Chilean
6th Grade
6th Grade Comparison
Immigrants from Bolivia
Chileans
96.3%
6TH GRADE
0.1/ 100
METRIC RATING
272nd/ 347
METRIC RANK
97.1%
6TH GRADE
52.1/ 100
METRIC RATING
170th/ 347
METRIC RANK
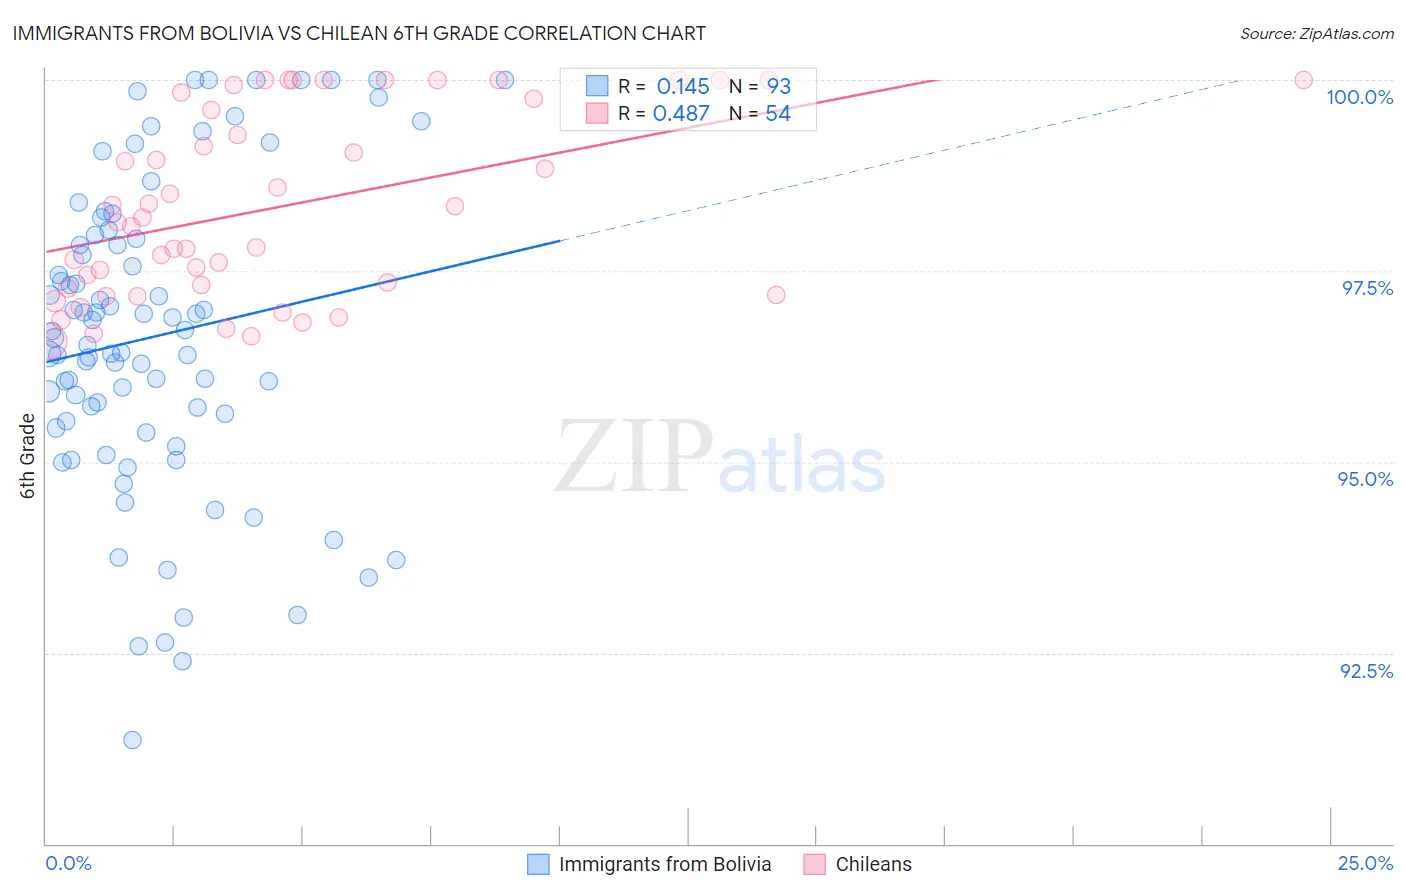
Immigrants from Bolivia vs Chilean 6th Grade Correlation Chart
The statistical analysis conducted on geographies consisting of 158,718,022 people shows a poor positive correlation between the proportion of Immigrants from Bolivia and percentage of population with at least 6th grade education in the United States with a correlation coefficient (R) of 0.145 and weighted average of 96.3%. Similarly, the statistical analysis conducted on geographies consisting of 256,683,580 people shows a moderate positive correlation between the proportion of Chileans and percentage of population with at least 6th grade education in the United States with a correlation coefficient (R) of 0.487 and weighted average of 97.1%, a difference of 0.79%.
6th Grade Correlation Summary
| Measurement | Immigrants from Bolivia | Chilean |
| Minimum | 91.4% | 96.6% |
| Maximum | 100.0% | 100.0% |
| Range | 8.6% | 3.4% |
| Mean | 96.6% | 98.3% |
| Median | 96.6% | 98.2% |
| Interquartile 25% (IQ1) | 95.5% | 97.3% |
| Interquartile 75% (IQ3) | 97.9% | 99.8% |
| Interquartile Range (IQR) | 2.5% | 2.5% |
| Standard Deviation (Sample) | 2.0% | 1.2% |
| Standard Deviation (Population) | 2.0% | 1.2% |
Similar Demographics by 6th Grade
Demographics Similar to Immigrants from Bolivia by 6th Grade
In terms of 6th grade, the demographic groups most similar to Immigrants from Bolivia are Immigrants from Cameroon (96.3%, a difference of 0.010%), Immigrants from Philippines (96.3%, a difference of 0.010%), Immigrants from Ghana (96.3%, a difference of 0.020%), Immigrants from Hong Kong (96.3%, a difference of 0.030%), and Yaqui (96.3%, a difference of 0.030%).
| Demographics | Rating | Rank | 6th Grade |
| Immigrants | Jamaica | 0.2 /100 | #265 | Tragic 96.4% |
| Ghanaians | 0.2 /100 | #266 | Tragic 96.4% |
| Afghans | 0.2 /100 | #267 | Tragic 96.4% |
| Immigrants | Uzbekistan | 0.2 /100 | #268 | Tragic 96.3% |
| West Indians | 0.2 /100 | #269 | Tragic 96.3% |
| Immigrants | South America | 0.2 /100 | #270 | Tragic 96.3% |
| Immigrants | Hong Kong | 0.2 /100 | #271 | Tragic 96.3% |
| Immigrants | Bolivia | 0.1 /100 | #272 | Tragic 96.3% |
| Immigrants | Cameroon | 0.1 /100 | #273 | Tragic 96.3% |
| Immigrants | Philippines | 0.1 /100 | #274 | Tragic 96.3% |
| Immigrants | Ghana | 0.1 /100 | #275 | Tragic 96.3% |
| Yaqui | 0.1 /100 | #276 | Tragic 96.3% |
| Immigrants | Western Africa | 0.1 /100 | #277 | Tragic 96.3% |
| Immigrants | Thailand | 0.1 /100 | #278 | Tragic 96.3% |
| Immigrants | Peru | 0.1 /100 | #279 | Tragic 96.2% |
Demographics Similar to Chileans by 6th Grade
In terms of 6th grade, the demographic groups most similar to Chileans are Bermudan (97.1%, a difference of 0.0%), Immigrants from Sri Lanka (97.1%, a difference of 0.0%), Immigrants from Italy (97.1%, a difference of 0.010%), Apache (97.1%, a difference of 0.010%), and Immigrants from Taiwan (97.1%, a difference of 0.010%).
| Demographics | Rating | Rank | 6th Grade |
| Albanians | 57.8 /100 | #163 | Average 97.1% |
| Immigrants | Korea | 57.7 /100 | #164 | Average 97.1% |
| Immigrants | Poland | 56.2 /100 | #165 | Average 97.1% |
| Immigrants | Italy | 53.8 /100 | #166 | Average 97.1% |
| Apache | 53.6 /100 | #167 | Average 97.1% |
| Immigrants | Taiwan | 53.5 /100 | #168 | Average 97.1% |
| Bermudans | 52.6 /100 | #169 | Average 97.1% |
| Chileans | 52.1 /100 | #170 | Average 97.1% |
| Immigrants | Sri Lanka | 51.7 /100 | #171 | Average 97.1% |
| Egyptians | 50.9 /100 | #172 | Average 97.1% |
| Arabs | 50.1 /100 | #173 | Average 97.0% |
| Venezuelans | 50.0 /100 | #174 | Average 97.0% |
| Immigrants | Kazakhstan | 47.3 /100 | #175 | Average 97.0% |
| Immigrants | Micronesia | 47.1 /100 | #176 | Average 97.0% |
| Mongolians | 46.7 /100 | #177 | Average 97.0% |