Immigrants from Ecuador vs Palestinian 2nd Grade
COMPARE
Immigrants from Ecuador
Palestinian
2nd Grade
2nd Grade Comparison
Immigrants from Ecuador
Palestinians
96.8%
2ND GRADE
0.0/ 100
METRIC RATING
314th/ 347
METRIC RANK
98.0%
2ND GRADE
83.9/ 100
METRIC RATING
140th/ 347
METRIC RANK
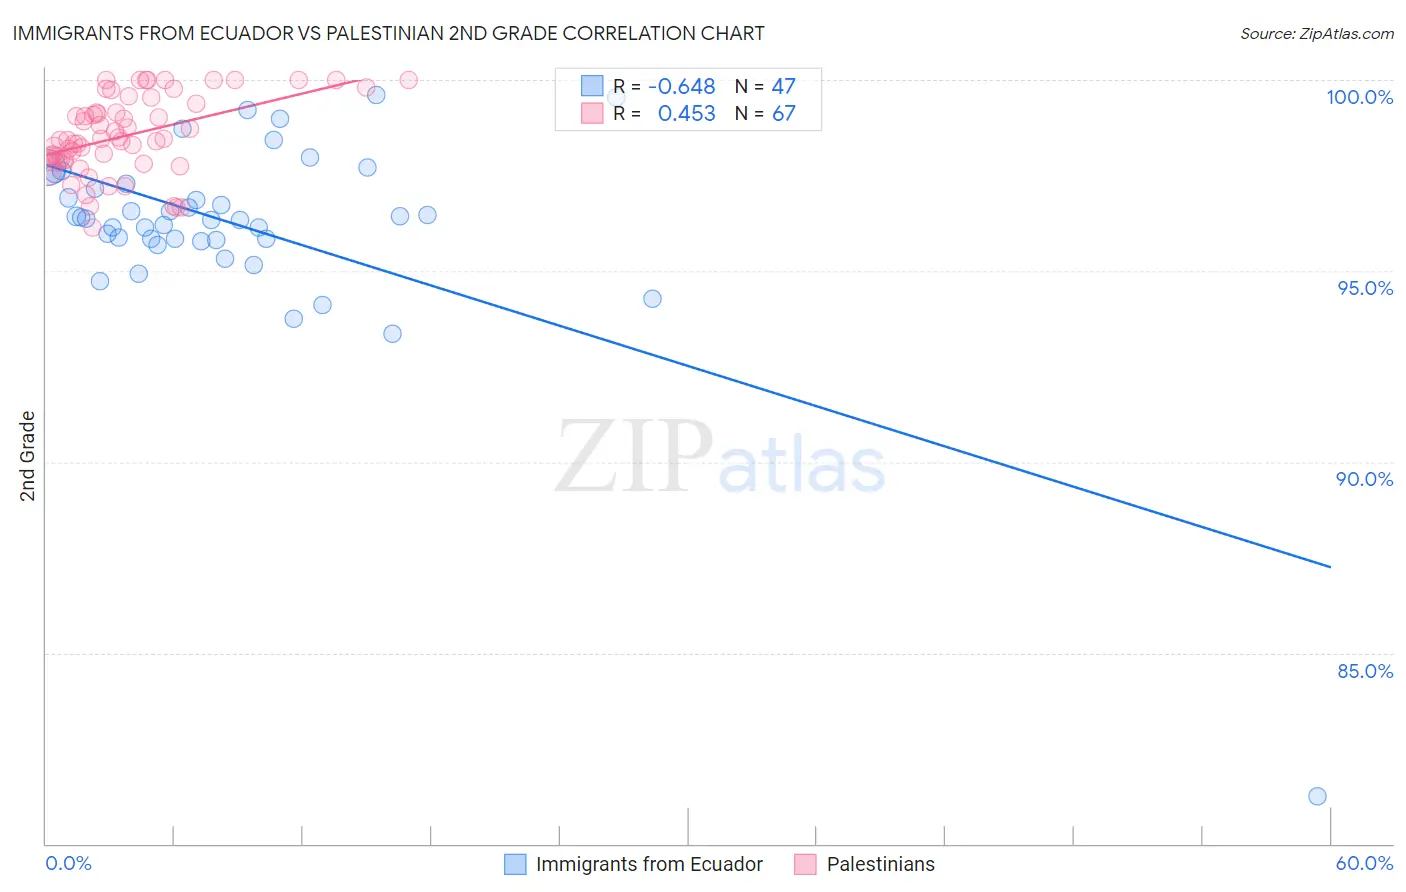
Immigrants from Ecuador vs Palestinian 2nd Grade Correlation Chart
The statistical analysis conducted on geographies consisting of 271,020,679 people shows a significant negative correlation between the proportion of Immigrants from Ecuador and percentage of population with at least 2nd grade education in the United States with a correlation coefficient (R) of -0.648 and weighted average of 96.8%. Similarly, the statistical analysis conducted on geographies consisting of 216,457,008 people shows a moderate positive correlation between the proportion of Palestinians and percentage of population with at least 2nd grade education in the United States with a correlation coefficient (R) of 0.453 and weighted average of 98.0%, a difference of 1.3%.
2nd Grade Correlation Summary
| Measurement | Immigrants from Ecuador | Palestinian |
| Minimum | 81.2% | 96.1% |
| Maximum | 99.6% | 100.0% |
| Range | 18.3% | 3.9% |
| Mean | 96.2% | 98.5% |
| Median | 96.4% | 98.4% |
| Interquartile 25% (IQ1) | 95.8% | 97.9% |
| Interquartile 75% (IQ3) | 97.3% | 99.4% |
| Interquartile Range (IQR) | 1.5% | 1.4% |
| Standard Deviation (Sample) | 2.6% | 1.0% |
| Standard Deviation (Population) | 2.6% | 1.0% |
Similar Demographics by 2nd Grade
Demographics Similar to Immigrants from Ecuador by 2nd Grade
In terms of 2nd grade, the demographic groups most similar to Immigrants from Ecuador are Immigrants from Belize (96.8%, a difference of 0.020%), Hispanic or Latino (96.8%, a difference of 0.030%), Honduran (96.7%, a difference of 0.030%), Immigrants from Laos (96.7%, a difference of 0.030%), and Indonesian (96.7%, a difference of 0.030%).
| Demographics | Rating | Rank | 2nd Grade |
| Immigrants | Azores | 0.0 /100 | #307 | Tragic 96.8% |
| Immigrants | Haiti | 0.0 /100 | #308 | Tragic 96.8% |
| Belizeans | 0.0 /100 | #309 | Tragic 96.8% |
| Sri Lankans | 0.0 /100 | #310 | Tragic 96.8% |
| Guyanese | 0.0 /100 | #311 | Tragic 96.8% |
| Cape Verdeans | 0.0 /100 | #312 | Tragic 96.8% |
| Hispanics or Latinos | 0.0 /100 | #313 | Tragic 96.8% |
| Immigrants | Ecuador | 0.0 /100 | #314 | Tragic 96.8% |
| Immigrants | Belize | 0.0 /100 | #315 | Tragic 96.8% |
| Hondurans | 0.0 /100 | #316 | Tragic 96.7% |
| Immigrants | Laos | 0.0 /100 | #317 | Tragic 96.7% |
| Indonesians | 0.0 /100 | #318 | Tragic 96.7% |
| Immigrants | Nicaragua | 0.0 /100 | #319 | Tragic 96.7% |
| Immigrants | Guyana | 0.0 /100 | #320 | Tragic 96.7% |
| Immigrants | Burma/Myanmar | 0.0 /100 | #321 | Tragic 96.7% |
Demographics Similar to Palestinians by 2nd Grade
In terms of 2nd grade, the demographic groups most similar to Palestinians are Immigrants from Turkey (98.0%, a difference of 0.010%), Blackfeet (98.0%, a difference of 0.020%), Burmese (98.0%, a difference of 0.020%), Alsatian (98.0%, a difference of 0.020%), and Hmong (98.0%, a difference of 0.020%).
| Demographics | Rating | Rank | 2nd Grade |
| Cambodians | 90.7 /100 | #133 | Exceptional 98.0% |
| Immigrants | Hungary | 89.7 /100 | #134 | Excellent 98.0% |
| Immigrants | Bulgaria | 89.7 /100 | #135 | Excellent 98.0% |
| Immigrants | Kuwait | 89.2 /100 | #136 | Excellent 98.0% |
| Immigrants | Romania | 88.3 /100 | #137 | Excellent 98.0% |
| Israelis | 87.9 /100 | #138 | Excellent 98.0% |
| Blackfeet | 87.5 /100 | #139 | Excellent 98.0% |
| Palestinians | 83.9 /100 | #140 | Excellent 98.0% |
| Immigrants | Turkey | 83.0 /100 | #141 | Excellent 98.0% |
| Burmese | 81.0 /100 | #142 | Excellent 98.0% |
| Alsatians | 80.5 /100 | #143 | Excellent 98.0% |
| Hmong | 80.0 /100 | #144 | Good 98.0% |
| Filipinos | 79.2 /100 | #145 | Good 98.0% |
| Immigrants | Israel | 78.0 /100 | #146 | Good 98.0% |
| Immigrants | Greece | 76.8 /100 | #147 | Good 98.0% |