Immigrants from Caribbean vs Brazilian 3rd Grade
COMPARE
Immigrants from Caribbean
Brazilian
3rd Grade
3rd Grade Comparison
Immigrants from Caribbean
Brazilians
96.7%
3RD GRADE
0.0/ 100
METRIC RATING
304th/ 347
METRIC RANK
97.8%
3RD GRADE
53.7/ 100
METRIC RATING
170th/ 347
METRIC RANK
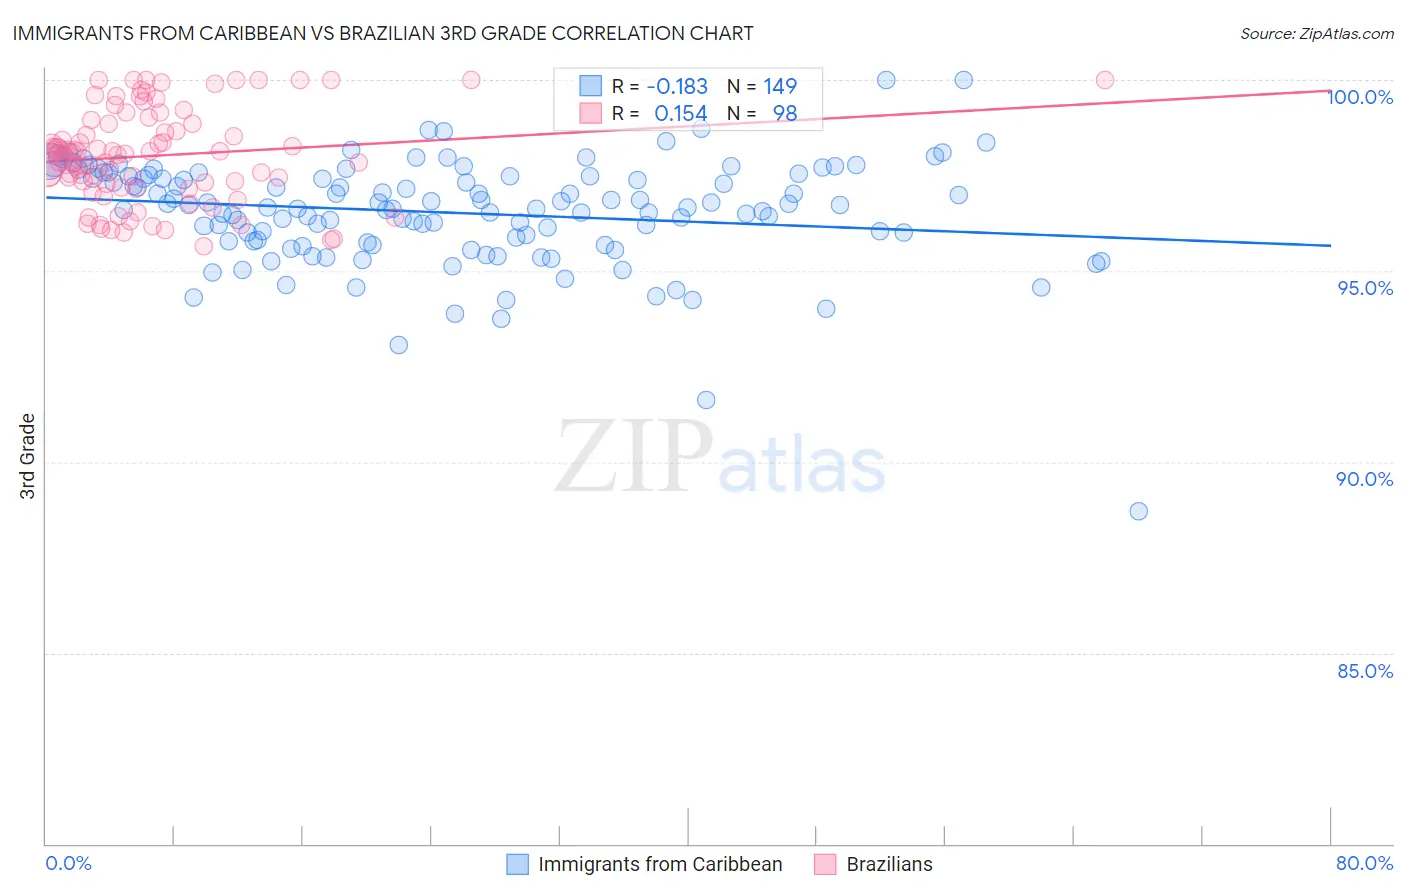
Immigrants from Caribbean vs Brazilian 3rd Grade Correlation Chart
The statistical analysis conducted on geographies consisting of 450,065,262 people shows a poor negative correlation between the proportion of Immigrants from Caribbean and percentage of population with at least 3rd grade education in the United States with a correlation coefficient (R) of -0.183 and weighted average of 96.7%. Similarly, the statistical analysis conducted on geographies consisting of 323,863,770 people shows a poor positive correlation between the proportion of Brazilians and percentage of population with at least 3rd grade education in the United States with a correlation coefficient (R) of 0.154 and weighted average of 97.8%, a difference of 1.1%.
3rd Grade Correlation Summary
| Measurement | Immigrants from Caribbean | Brazilian |
| Minimum | 88.7% | 95.6% |
| Maximum | 100.0% | 100.0% |
| Range | 11.3% | 4.4% |
| Mean | 96.5% | 98.0% |
| Median | 96.7% | 98.1% |
| Interquartile 25% (IQ1) | 95.8% | 97.3% |
| Interquartile 75% (IQ3) | 97.5% | 98.9% |
| Interquartile Range (IQR) | 1.7% | 1.6% |
| Standard Deviation (Sample) | 1.4% | 1.2% |
| Standard Deviation (Population) | 1.4% | 1.2% |
Similar Demographics by 3rd Grade
Demographics Similar to Immigrants from Caribbean by 3rd Grade
In terms of 3rd grade, the demographic groups most similar to Immigrants from Caribbean are Central American Indian (96.7%, a difference of 0.010%), Immigrants from Somalia (96.8%, a difference of 0.020%), Ecuadorian (96.7%, a difference of 0.020%), Guyanese (96.7%, a difference of 0.040%), and Nicaraguan (96.7%, a difference of 0.060%).
| Demographics | Rating | Rank | 3rd Grade |
| Haitians | 0.0 /100 | #297 | Tragic 96.9% |
| Immigrants | Dominica | 0.0 /100 | #298 | Tragic 96.9% |
| Somalis | 0.0 /100 | #299 | Tragic 96.8% |
| Immigrants | South Eastern Asia | 0.0 /100 | #300 | Tragic 96.8% |
| Immigrants | Cuba | 0.0 /100 | #301 | Tragic 96.8% |
| Immigrants | Somalia | 0.0 /100 | #302 | Tragic 96.8% |
| Ecuadorians | 0.0 /100 | #303 | Tragic 96.7% |
| Immigrants | Caribbean | 0.0 /100 | #304 | Tragic 96.7% |
| Central American Indians | 0.0 /100 | #305 | Tragic 96.7% |
| Guyanese | 0.0 /100 | #306 | Tragic 96.7% |
| Nicaraguans | 0.0 /100 | #307 | Tragic 96.7% |
| Immigrants | Haiti | 0.0 /100 | #308 | Tragic 96.7% |
| Sri Lankans | 0.0 /100 | #309 | Tragic 96.7% |
| Cape Verdeans | 0.0 /100 | #310 | Tragic 96.6% |
| Immigrants | Guyana | 0.0 /100 | #311 | Tragic 96.6% |
Demographics Similar to Brazilians by 3rd Grade
In terms of 3rd grade, the demographic groups most similar to Brazilians are Immigrants from Spain (97.8%, a difference of 0.0%), Comanche (97.8%, a difference of 0.0%), Marshallese (97.8%, a difference of 0.010%), Immigrants from Bosnia and Herzegovina (97.8%, a difference of 0.010%), and Ugandan (97.8%, a difference of 0.010%).
| Demographics | Rating | Rank | 3rd Grade |
| Marshallese | 57.2 /100 | #163 | Average 97.8% |
| Immigrants | Bosnia and Herzegovina | 56.2 /100 | #164 | Average 97.8% |
| Ugandans | 56.1 /100 | #165 | Average 97.8% |
| Dutch West Indians | 55.5 /100 | #166 | Average 97.8% |
| Chileans | 55.3 /100 | #167 | Average 97.8% |
| Immigrants | Spain | 54.3 /100 | #168 | Average 97.8% |
| Comanche | 53.8 /100 | #169 | Average 97.8% |
| Brazilians | 53.7 /100 | #170 | Average 97.8% |
| Kenyans | 51.8 /100 | #171 | Average 97.8% |
| Spanish Americans | 51.8 /100 | #172 | Average 97.8% |
| Immigrants | Korea | 50.9 /100 | #173 | Average 97.8% |
| Navajo | 50.0 /100 | #174 | Average 97.8% |
| Immigrants | Micronesia | 47.6 /100 | #175 | Average 97.8% |
| Immigrants | Poland | 47.1 /100 | #176 | Average 97.8% |
| Egyptians | 46.6 /100 | #177 | Average 97.7% |