Immigrants from Canada vs Immigrants from Yemen 10th Grade
COMPARE
Immigrants from Canada
Immigrants from Yemen
10th Grade
10th Grade Comparison
Immigrants from Canada
Immigrants from Yemen
95.1%
10TH GRADE
99.8/ 100
METRIC RATING
50th/ 347
METRIC RANK
89.1%
10TH GRADE
0.0/ 100
METRIC RATING
330th/ 347
METRIC RANK
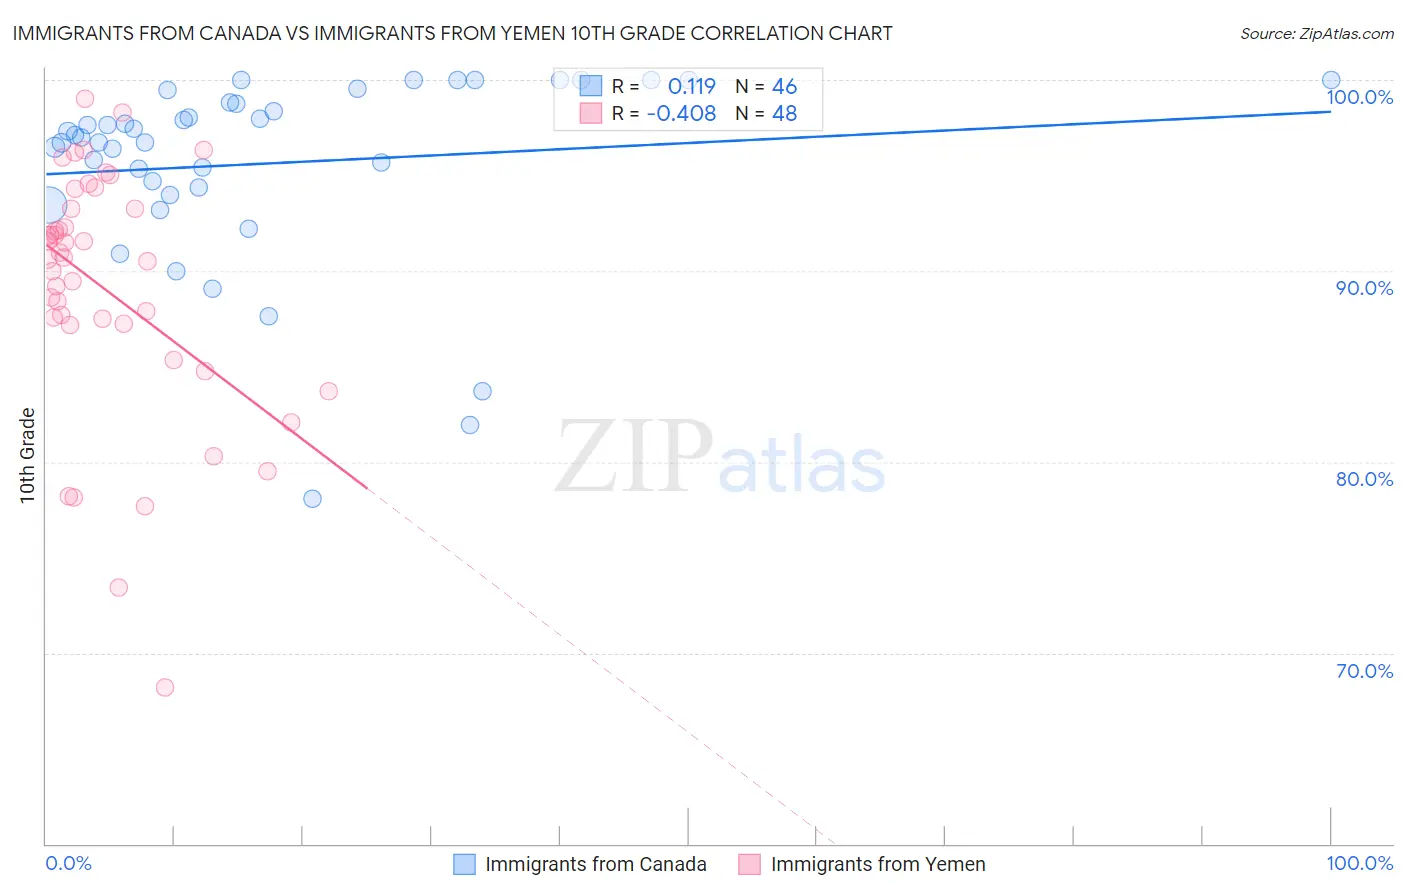
Immigrants from Canada vs Immigrants from Yemen 10th Grade Correlation Chart
The statistical analysis conducted on geographies consisting of 459,397,383 people shows a poor positive correlation between the proportion of Immigrants from Canada and percentage of population with at least 10th grade education in the United States with a correlation coefficient (R) of 0.119 and weighted average of 95.1%. Similarly, the statistical analysis conducted on geographies consisting of 82,421,120 people shows a moderate negative correlation between the proportion of Immigrants from Yemen and percentage of population with at least 10th grade education in the United States with a correlation coefficient (R) of -0.408 and weighted average of 89.1%, a difference of 6.8%.
10th Grade Correlation Summary
| Measurement | Immigrants from Canada | Immigrants from Yemen |
| Minimum | 78.1% | 68.2% |
| Maximum | 100.0% | 99.0% |
| Range | 21.9% | 30.8% |
| Mean | 95.6% | 89.0% |
| Median | 97.0% | 90.7% |
| Interquartile 25% (IQ1) | 94.4% | 87.2% |
| Interquartile 75% (IQ3) | 98.8% | 93.3% |
| Interquartile Range (IQR) | 4.5% | 6.1% |
| Standard Deviation (Sample) | 4.9% | 6.5% |
| Standard Deviation (Population) | 4.9% | 6.5% |
Similar Demographics by 10th Grade
Demographics Similar to Immigrants from Canada by 10th Grade
In terms of 10th grade, the demographic groups most similar to Immigrants from Canada are Austrian (95.1%, a difference of 0.010%), Ottawa (95.1%, a difference of 0.010%), Immigrants from North America (95.0%, a difference of 0.020%), Immigrants from Austria (95.1%, a difference of 0.030%), and Immigrants from Lithuania (95.0%, a difference of 0.040%).
| Demographics | Rating | Rank | 10th Grade |
| Macedonians | 99.9 /100 | #43 | Exceptional 95.2% |
| Immigrants | Northern Europe | 99.9 /100 | #44 | Exceptional 95.2% |
| Greeks | 99.9 /100 | #45 | Exceptional 95.2% |
| Czechoslovakians | 99.9 /100 | #46 | Exceptional 95.1% |
| Serbians | 99.9 /100 | #47 | Exceptional 95.1% |
| Australians | 99.9 /100 | #48 | Exceptional 95.1% |
| Immigrants | Austria | 99.9 /100 | #49 | Exceptional 95.1% |
| Immigrants | Canada | 99.8 /100 | #50 | Exceptional 95.1% |
| Austrians | 99.8 /100 | #51 | Exceptional 95.1% |
| Ottawa | 99.8 /100 | #52 | Exceptional 95.1% |
| Immigrants | North America | 99.8 /100 | #53 | Exceptional 95.0% |
| Immigrants | Lithuania | 99.8 /100 | #54 | Exceptional 95.0% |
| Immigrants | Ireland | 99.8 /100 | #55 | Exceptional 95.0% |
| New Zealanders | 99.8 /100 | #56 | Exceptional 95.0% |
| Ukrainians | 99.8 /100 | #57 | Exceptional 95.0% |
Demographics Similar to Immigrants from Yemen by 10th Grade
In terms of 10th grade, the demographic groups most similar to Immigrants from Yemen are Mexican American Indian (89.0%, a difference of 0.030%), Immigrants from the Azores (89.0%, a difference of 0.070%), Honduran (89.0%, a difference of 0.10%), Hispanic or Latino (88.9%, a difference of 0.22%), and Dominican (89.4%, a difference of 0.35%).
| Demographics | Rating | Rank | 10th Grade |
| Immigrants | Belize | 0.0 /100 | #323 | Tragic 90.1% |
| Immigrants | Armenia | 0.0 /100 | #324 | Tragic 89.9% |
| Puerto Ricans | 0.0 /100 | #325 | Tragic 89.8% |
| Central American Indians | 0.0 /100 | #326 | Tragic 89.7% |
| Immigrants | Nicaragua | 0.0 /100 | #327 | Tragic 89.5% |
| Immigrants | Cabo Verde | 0.0 /100 | #328 | Tragic 89.5% |
| Dominicans | 0.0 /100 | #329 | Tragic 89.4% |
| Immigrants | Yemen | 0.0 /100 | #330 | Tragic 89.1% |
| Mexican American Indians | 0.0 /100 | #331 | Tragic 89.0% |
| Immigrants | Azores | 0.0 /100 | #332 | Tragic 89.0% |
| Hondurans | 0.0 /100 | #333 | Tragic 89.0% |
| Hispanics or Latinos | 0.0 /100 | #334 | Tragic 88.9% |
| Immigrants | Dominican Republic | 0.0 /100 | #335 | Tragic 88.7% |
| Immigrants | Honduras | 0.0 /100 | #336 | Tragic 88.5% |
| Central Americans | 0.0 /100 | #337 | Tragic 88.4% |