Immigrants from Canada vs Carpatho Rusyn 10th Grade
COMPARE
Immigrants from Canada
Carpatho Rusyn
10th Grade
10th Grade Comparison
Immigrants from Canada
Carpatho Rusyns
95.1%
10TH GRADE
99.8/ 100
METRIC RATING
50th/ 347
METRIC RANK
95.9%
10TH GRADE
100.0/ 100
METRIC RATING
5th/ 347
METRIC RANK
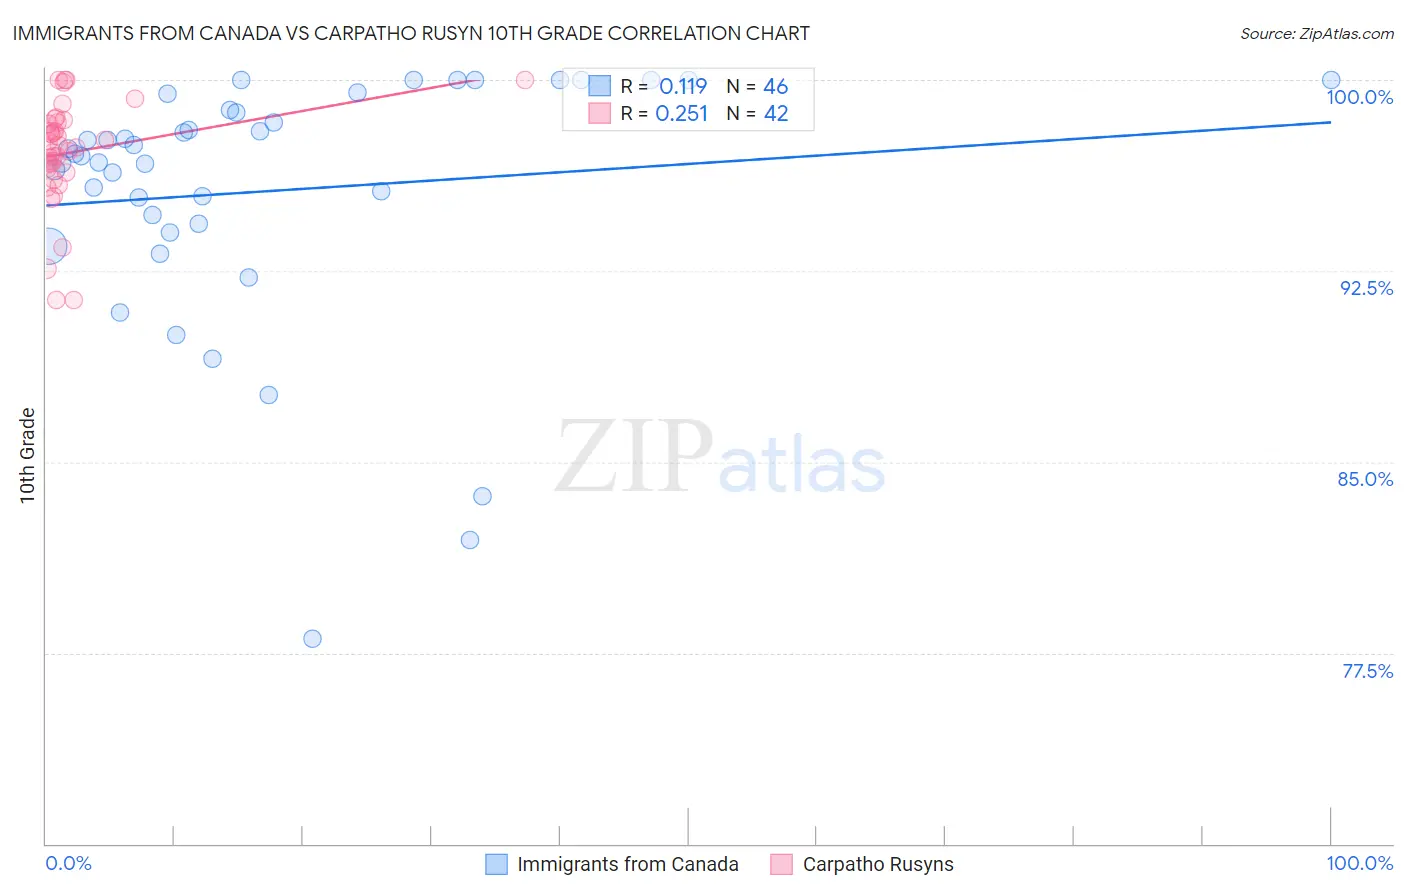
Immigrants from Canada vs Carpatho Rusyn 10th Grade Correlation Chart
The statistical analysis conducted on geographies consisting of 459,397,383 people shows a poor positive correlation between the proportion of Immigrants from Canada and percentage of population with at least 10th grade education in the United States with a correlation coefficient (R) of 0.119 and weighted average of 95.1%. Similarly, the statistical analysis conducted on geographies consisting of 58,871,690 people shows a weak positive correlation between the proportion of Carpatho Rusyns and percentage of population with at least 10th grade education in the United States with a correlation coefficient (R) of 0.251 and weighted average of 95.9%, a difference of 0.90%.
10th Grade Correlation Summary
| Measurement | Immigrants from Canada | Carpatho Rusyn |
| Minimum | 78.1% | 91.4% |
| Maximum | 100.0% | 100.0% |
| Range | 21.9% | 8.6% |
| Mean | 95.6% | 97.2% |
| Median | 97.0% | 97.4% |
| Interquartile 25% (IQ1) | 94.4% | 96.5% |
| Interquartile 75% (IQ3) | 98.8% | 98.3% |
| Interquartile Range (IQR) | 4.5% | 1.8% |
| Standard Deviation (Sample) | 4.9% | 2.1% |
| Standard Deviation (Population) | 4.9% | 2.0% |
Similar Demographics by 10th Grade
Demographics Similar to Immigrants from Canada by 10th Grade
In terms of 10th grade, the demographic groups most similar to Immigrants from Canada are Austrian (95.1%, a difference of 0.010%), Ottawa (95.1%, a difference of 0.010%), Immigrants from North America (95.0%, a difference of 0.020%), Immigrants from Austria (95.1%, a difference of 0.030%), and Immigrants from Lithuania (95.0%, a difference of 0.040%).
| Demographics | Rating | Rank | 10th Grade |
| Macedonians | 99.9 /100 | #43 | Exceptional 95.2% |
| Immigrants | Northern Europe | 99.9 /100 | #44 | Exceptional 95.2% |
| Greeks | 99.9 /100 | #45 | Exceptional 95.2% |
| Czechoslovakians | 99.9 /100 | #46 | Exceptional 95.1% |
| Serbians | 99.9 /100 | #47 | Exceptional 95.1% |
| Australians | 99.9 /100 | #48 | Exceptional 95.1% |
| Immigrants | Austria | 99.9 /100 | #49 | Exceptional 95.1% |
| Immigrants | Canada | 99.8 /100 | #50 | Exceptional 95.1% |
| Austrians | 99.8 /100 | #51 | Exceptional 95.1% |
| Ottawa | 99.8 /100 | #52 | Exceptional 95.1% |
| Immigrants | North America | 99.8 /100 | #53 | Exceptional 95.0% |
| Immigrants | Lithuania | 99.8 /100 | #54 | Exceptional 95.0% |
| Immigrants | Ireland | 99.8 /100 | #55 | Exceptional 95.0% |
| New Zealanders | 99.8 /100 | #56 | Exceptional 95.0% |
| Ukrainians | 99.8 /100 | #57 | Exceptional 95.0% |
Demographics Similar to Carpatho Rusyns by 10th Grade
In terms of 10th grade, the demographic groups most similar to Carpatho Rusyns are Slovene (95.9%, a difference of 0.020%), Swedish (95.9%, a difference of 0.020%), Polish (95.8%, a difference of 0.10%), German (95.8%, a difference of 0.11%), and Slovak (96.0%, a difference of 0.12%).
| Demographics | Rating | Rank | 10th Grade |
| Norwegians | 100.0 /100 | #1 | Exceptional 96.2% |
| Slovaks | 100.0 /100 | #2 | Exceptional 96.0% |
| Slovenes | 100.0 /100 | #3 | Exceptional 95.9% |
| Swedes | 100.0 /100 | #4 | Exceptional 95.9% |
| Carpatho Rusyns | 100.0 /100 | #5 | Exceptional 95.9% |
| Poles | 100.0 /100 | #6 | Exceptional 95.8% |
| Germans | 100.0 /100 | #7 | Exceptional 95.8% |
| Lithuanians | 100.0 /100 | #8 | Exceptional 95.8% |
| Finns | 100.0 /100 | #9 | Exceptional 95.8% |
| Croatians | 100.0 /100 | #10 | Exceptional 95.7% |
| Danes | 100.0 /100 | #11 | Exceptional 95.7% |
| Tlingit-Haida | 100.0 /100 | #12 | Exceptional 95.7% |
| English | 100.0 /100 | #13 | Exceptional 95.6% |
| Tsimshian | 100.0 /100 | #14 | Exceptional 95.6% |
| Irish | 100.0 /100 | #15 | Exceptional 95.6% |