Immigrants from Jordan vs Immigrants from Yemen 10th Grade
COMPARE
Immigrants from Jordan
Immigrants from Yemen
10th Grade
10th Grade Comparison
Immigrants from Jordan
Immigrants from Yemen
94.1%
10TH GRADE
87.6/ 100
METRIC RATING
140th/ 347
METRIC RANK
89.1%
10TH GRADE
0.0/ 100
METRIC RATING
330th/ 347
METRIC RANK
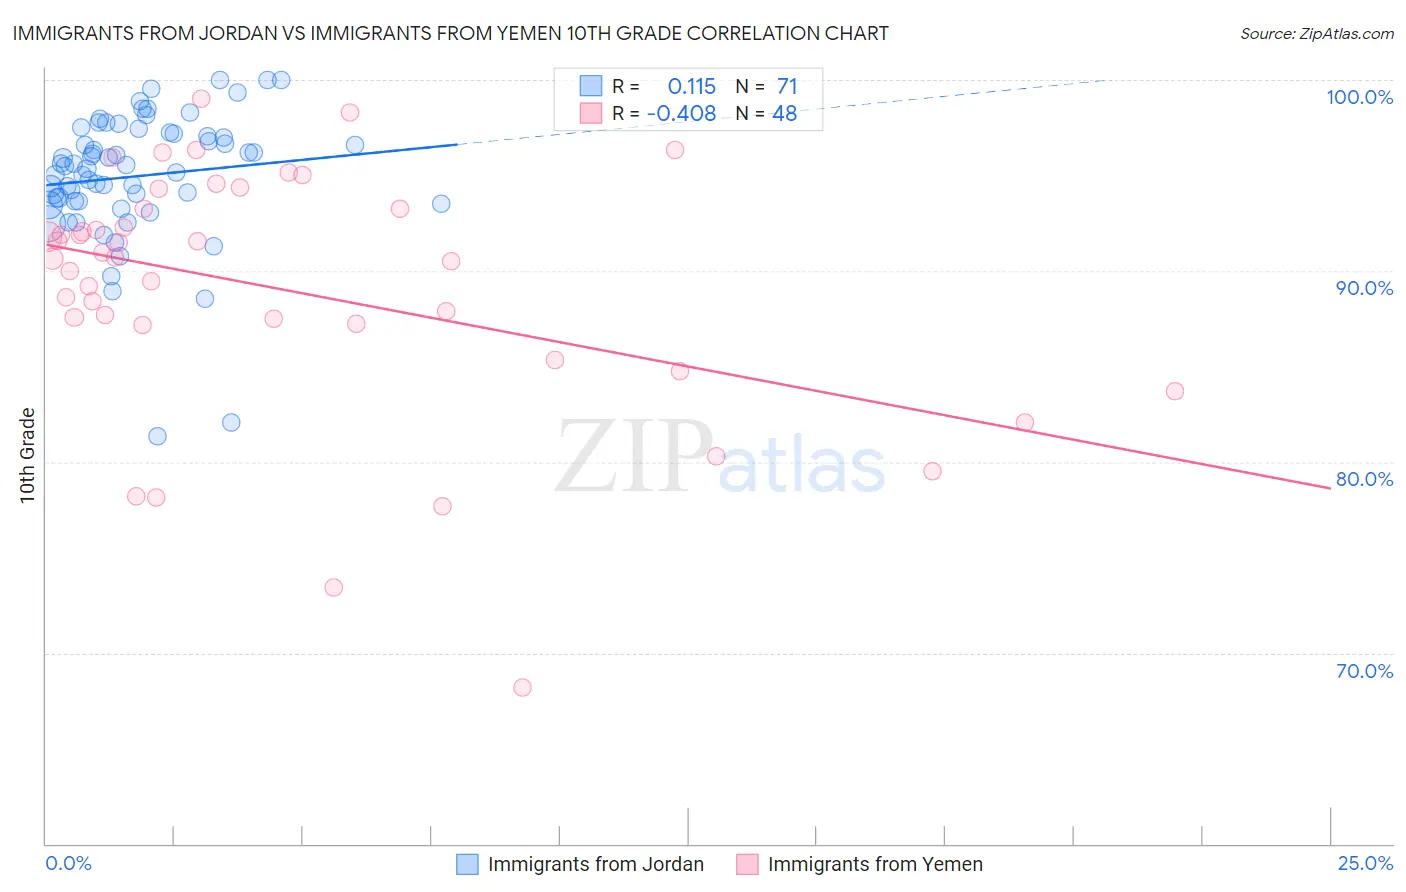
Immigrants from Jordan vs Immigrants from Yemen 10th Grade Correlation Chart
The statistical analysis conducted on geographies consisting of 181,278,272 people shows a poor positive correlation between the proportion of Immigrants from Jordan and percentage of population with at least 10th grade education in the United States with a correlation coefficient (R) of 0.115 and weighted average of 94.1%. Similarly, the statistical analysis conducted on geographies consisting of 82,421,120 people shows a moderate negative correlation between the proportion of Immigrants from Yemen and percentage of population with at least 10th grade education in the United States with a correlation coefficient (R) of -0.408 and weighted average of 89.1%, a difference of 5.7%.
10th Grade Correlation Summary
| Measurement | Immigrants from Jordan | Immigrants from Yemen |
| Minimum | 81.3% | 68.2% |
| Maximum | 100.0% | 99.0% |
| Range | 18.7% | 30.8% |
| Mean | 95.0% | 89.0% |
| Median | 95.5% | 90.7% |
| Interquartile 25% (IQ1) | 93.6% | 87.2% |
| Interquartile 75% (IQ3) | 97.2% | 93.3% |
| Interquartile Range (IQR) | 3.6% | 6.1% |
| Standard Deviation (Sample) | 3.4% | 6.5% |
| Standard Deviation (Population) | 3.4% | 6.5% |
Similar Demographics by 10th Grade
Demographics Similar to Immigrants from Jordan by 10th Grade
In terms of 10th grade, the demographic groups most similar to Immigrants from Jordan are Hmong (94.1%, a difference of 0.020%), Albanian (94.1%, a difference of 0.020%), Immigrants from Bosnia and Herzegovina (94.2%, a difference of 0.040%), Immigrants from Sri Lanka (94.2%, a difference of 0.050%), and Cherokee (94.1%, a difference of 0.050%).
| Demographics | Rating | Rank | 10th Grade |
| Creek | 91.9 /100 | #133 | Exceptional 94.2% |
| Osage | 91.7 /100 | #134 | Exceptional 94.2% |
| Immigrants | Korea | 91.3 /100 | #135 | Exceptional 94.2% |
| Shoshone | 90.8 /100 | #136 | Exceptional 94.2% |
| Arapaho | 90.5 /100 | #137 | Exceptional 94.2% |
| Immigrants | Sri Lanka | 89.9 /100 | #138 | Excellent 94.2% |
| Immigrants | Bosnia and Herzegovina | 89.4 /100 | #139 | Excellent 94.2% |
| Immigrants | Jordan | 87.6 /100 | #140 | Excellent 94.1% |
| Hmong | 86.6 /100 | #141 | Excellent 94.1% |
| Albanians | 86.5 /100 | #142 | Excellent 94.1% |
| Cherokee | 84.9 /100 | #143 | Excellent 94.1% |
| Immigrants | Kazakhstan | 84.9 /100 | #144 | Excellent 94.1% |
| Immigrants | Nonimmigrants | 83.8 /100 | #145 | Excellent 94.1% |
| Chickasaw | 82.6 /100 | #146 | Excellent 94.1% |
| Immigrants | Ukraine | 81.5 /100 | #147 | Excellent 94.0% |
Demographics Similar to Immigrants from Yemen by 10th Grade
In terms of 10th grade, the demographic groups most similar to Immigrants from Yemen are Mexican American Indian (89.0%, a difference of 0.030%), Immigrants from the Azores (89.0%, a difference of 0.070%), Honduran (89.0%, a difference of 0.10%), Hispanic or Latino (88.9%, a difference of 0.22%), and Dominican (89.4%, a difference of 0.35%).
| Demographics | Rating | Rank | 10th Grade |
| Immigrants | Belize | 0.0 /100 | #323 | Tragic 90.1% |
| Immigrants | Armenia | 0.0 /100 | #324 | Tragic 89.9% |
| Puerto Ricans | 0.0 /100 | #325 | Tragic 89.8% |
| Central American Indians | 0.0 /100 | #326 | Tragic 89.7% |
| Immigrants | Nicaragua | 0.0 /100 | #327 | Tragic 89.5% |
| Immigrants | Cabo Verde | 0.0 /100 | #328 | Tragic 89.5% |
| Dominicans | 0.0 /100 | #329 | Tragic 89.4% |
| Immigrants | Yemen | 0.0 /100 | #330 | Tragic 89.1% |
| Mexican American Indians | 0.0 /100 | #331 | Tragic 89.0% |
| Immigrants | Azores | 0.0 /100 | #332 | Tragic 89.0% |
| Hondurans | 0.0 /100 | #333 | Tragic 89.0% |
| Hispanics or Latinos | 0.0 /100 | #334 | Tragic 88.9% |
| Immigrants | Dominican Republic | 0.0 /100 | #335 | Tragic 88.7% |
| Immigrants | Honduras | 0.0 /100 | #336 | Tragic 88.5% |
| Central Americans | 0.0 /100 | #337 | Tragic 88.4% |