Immigrants from Eastern Europe vs Carpatho Rusyn 10th Grade

COMPARE

Immigrants from Eastern Europe
Race
Ancestry
AfghanAfricanAlaska NativeAlaskan AthabascanAlbanianAleutAlsatianAmericanApacheArabArapahoArgentineanArmenianAssyrian/Chaldean/SyriacAustralianAustrianBahamianBangladeshiBarbadianBasqueBelgianBelizeanBermudanBhutaneseBlackfeetBolivianBrazilianBritishBritish West IndianBulgarianBurmeseCajunCambodianCanadianCape VerdeanCelticCentral AmericanCentral American IndianCherokeeCheyenneChickasawChileanChineseChippewaChoctawColombianColvilleComancheCosta RicanCreeCreekCroatianCrowCubanCypriotCzechCzechoslovakianDanishDelawareDominicanDutchDutch West IndianEastern EuropeanEcuadorianEgyptianEnglishEstonianEthiopianEuropeanFijianFilipinoFinnishFrenchFrench American IndianFrench CanadianGermanGerman RussianGhanaianGreekGuamanian/ChamorroGuatemalanGuyaneseHaitianHmongHonduranHopiHoumaHungarianIcelanderIndian (Asian)IndonesianInupiatIranianIraqiIrishIroquoisIsraeliItalianJamaicanJapaneseJordanianKenyanKiowaKoreanLaotianLatvianLebaneseLiberianLithuanianLumbeeLuxembourgerMacedonianMalaysianMalteseMarshalleseMenomineeMexicanMexican American IndianMongolianMoroccanNative HawaiianNavajoNepaleseNew ZealanderNicaraguanNigerianNorthern EuropeanNorwegianOkinawanOsageOttawaPaiutePakistaniPalestinianPanamanianParaguayanPennsylvania GermanPeruvianPimaPolishPortuguesePotawatomiPuebloPuerto RicanPuget Sound SalishRomanianRussianSalvadoranSamoanScandinavianScotch-IrishScottishSeminoleSenegaleseSerbianShoshoneSierra LeoneanSiouxSlavicSlovakSloveneSomaliSouth AfricanSouth AmericanSouth American IndianSoviet UnionSpaniardSpanishSpanish AmericanSpanish American IndianSri LankanSubsaharan AfricanSudaneseSwedishSwissSyrianTaiwaneseThaiTlingit-HaidaTohono O'OdhamTonganTrinidadian and TobagonianTsimshianTurkishU.S. Virgin IslanderUgandanUkrainianUruguayanUteVenezuelanVietnameseWelshWest IndianYakamaYaquiYugoslavianYumanYup'ikZimbabwean
Immigration
NonimmigrantsImmigrantsAfghanistanAfricaAlbaniaArgentinaArmeniaAsiaAustraliaAustriaBahamasBangladeshBarbadosBelarusBelgiumBelizeBoliviaBosnia and HerzegovinaBrazilBulgariaBurma/MyanmarCabo VerdeCambodiaCameroonCanadaCaribbeanCentral AmericaChileChinaColombiaCongoCosta RicaCroatiaCubaCzechoslovakiaDenmarkDominicaDominican RepublicEastern AfricaEastern AsiaEastern EuropeEcuadorEgyptEl SalvadorEnglandEritreaEthiopiaEuropeFijiFranceGermanyGhanaGreeceGrenadaGuatemalaGuyanaHaitiHondurasHong KongHungaryIndiaIndonesiaIranIraqIrelandIsraelItalyJamaicaJapanJordanKazakhstanKenyaKoreaKuwaitLaosLatin AmericaLatviaLebanonLiberiaLithuaniaMalaysiaMexicoMicronesiaMiddle AfricaMoldovaMoroccoNepalNetherlandsNicaraguaNigeriaNorth AmericaNorth MacedoniaNorthern AfricaNorthern EuropeNorwayOceaniaPakistanPanamaPeruPhilippinesPolandPortugalRomaniaRussiaSaudi ArabiaScotlandSenegalSerbiaSierra LeoneSingaporeSomaliaSouth AfricaSouth AmericaSouth Central AsiaSouth Eastern AsiaSouthern EuropeSpainSri LankaSt. Vincent and the GrenadinesSudanSwedenSwitzerlandSyriaTaiwanThailandTrinidad and TobagoTurkeyUgandaUkraineUruguayUzbekistanVenezuelaVietnamWest IndiesWestern AfricaWestern AsiaWestern EuropeYemenZaireZimbabweAzores
Carpatho Rusyn
Race
Ancestry
AfghanAfricanAlaska NativeAlaskan AthabascanAlbanianAleutAlsatianAmericanApacheArabArapahoArgentineanArmenianAssyrian/Chaldean/SyriacAustralianAustrianBahamianBangladeshiBarbadianBasqueBelgianBelizeanBermudanBhutaneseBlackfeetBolivianBrazilianBritishBritish West IndianBulgarianBurmeseCajunCambodianCanadianCape VerdeanCarpatho RusynCelticCentral AmericanCentral American IndianCherokeeCheyenneChickasawChileanChineseChippewaChoctawColombianColvilleComancheCosta RicanCreeCreekCroatianCrowCubanCypriotCzechCzechoslovakianDanishDelawareDominicanDutchDutch West IndianEastern EuropeanEcuadorianEgyptianEnglishEstonianEthiopianEuropeanFijianFilipinoFinnishFrenchFrench American IndianFrench CanadianGermanGerman RussianGhanaianGreekGuamanian/ChamorroGuatemalanGuyaneseHaitianHmongHonduranHopiHoumaHungarianIcelanderIndian (Asian)IndonesianInupiatIranianIraqiIrishIroquoisIsraeliItalianJamaicanJapaneseJordanianKenyanKiowaKoreanLaotianLatvianLebaneseLiberianLithuanianLumbeeLuxembourgerMacedonianMalaysianMalteseMarshalleseMenomineeMexicanMexican American IndianMongolianMoroccanNative HawaiianNavajoNepaleseNew ZealanderNicaraguanNigerianNorthern EuropeanNorwegianOkinawanOsageOttawaPaiutePakistaniPalestinianPanamanianParaguayanPennsylvania GermanPeruvianPimaPolishPortuguesePotawatomiPuebloPuerto RicanPuget Sound SalishRomanianRussianSalvadoranSamoanScandinavianScotch-IrishScottishSeminoleSenegaleseSerbianShoshoneSierra LeoneanSiouxSlavicSlovakSloveneSomaliSouth AfricanSouth AmericanSouth American IndianSoviet UnionSpaniardSpanishSpanish AmericanSpanish American IndianSri LankanSubsaharan AfricanSudaneseSwedishSwissSyrianTaiwaneseThaiTlingit-HaidaTohono O'OdhamTonganTrinidadian and TobagonianTsimshianTurkishU.S. Virgin IslanderUgandanUkrainianUruguayanUteVenezuelanVietnameseWelshWest IndianYakamaYaquiYugoslavianYumanYup'ikZimbabwean
Immigration
NonimmigrantsImmigrantsAfghanistanAfricaAlbaniaArgentinaArmeniaAsiaAustraliaAustriaBahamasBangladeshBarbadosBelarusBelgiumBelizeBoliviaBosnia and HerzegovinaBrazilBulgariaBurma/MyanmarCabo VerdeCambodiaCameroonCanadaCaribbeanCentral AmericaChileChinaColombiaCongoCosta RicaCroatiaCubaCzechoslovakiaDenmarkDominicaDominican RepublicEastern AfricaEastern AsiaEcuadorEgyptEl SalvadorEnglandEritreaEthiopiaEuropeFijiFranceGermanyGhanaGreeceGrenadaGuatemalaGuyanaHaitiHondurasHong KongHungaryIndiaIndonesiaIranIraqIrelandIsraelItalyJamaicaJapanJordanKazakhstanKenyaKoreaKuwaitLaosLatin AmericaLatviaLebanonLiberiaLithuaniaMalaysiaMexicoMicronesiaMiddle AfricaMoldovaMoroccoNepalNetherlandsNicaraguaNigeriaNorth AmericaNorth MacedoniaNorthern AfricaNorthern EuropeNorwayOceaniaPakistanPanamaPeruPhilippinesPolandPortugalRomaniaRussiaSaudi ArabiaScotlandSenegalSerbiaSierra LeoneSingaporeSomaliaSouth AfricaSouth AmericaSouth Central AsiaSouth Eastern AsiaSouthern EuropeSpainSri LankaSt. Vincent and the GrenadinesSudanSwedenSwitzerlandSyriaTaiwanThailandTrinidad and TobagoTurkeyUgandaUkraineUruguayUzbekistanVenezuelaVietnamWest IndiesWestern AfricaWestern AsiaWestern EuropeYemenZaireZimbabweAzores
10th Grade
Income
Poverty
Unemployment
Labor Participation
Family Structure
Vehicle Availability
Education Level
Disability

10th Grade Comparison

Immigrants from Eastern Europe

Carpatho Rusyns

Exceptional
Exceptional
94.3%
10TH GRADE
92.5/ 100
METRIC RATING
131st/ 347
METRIC RANK
95.9%
10TH GRADE
100.0/ 100
METRIC RATING
5th/ 347
METRIC RANK

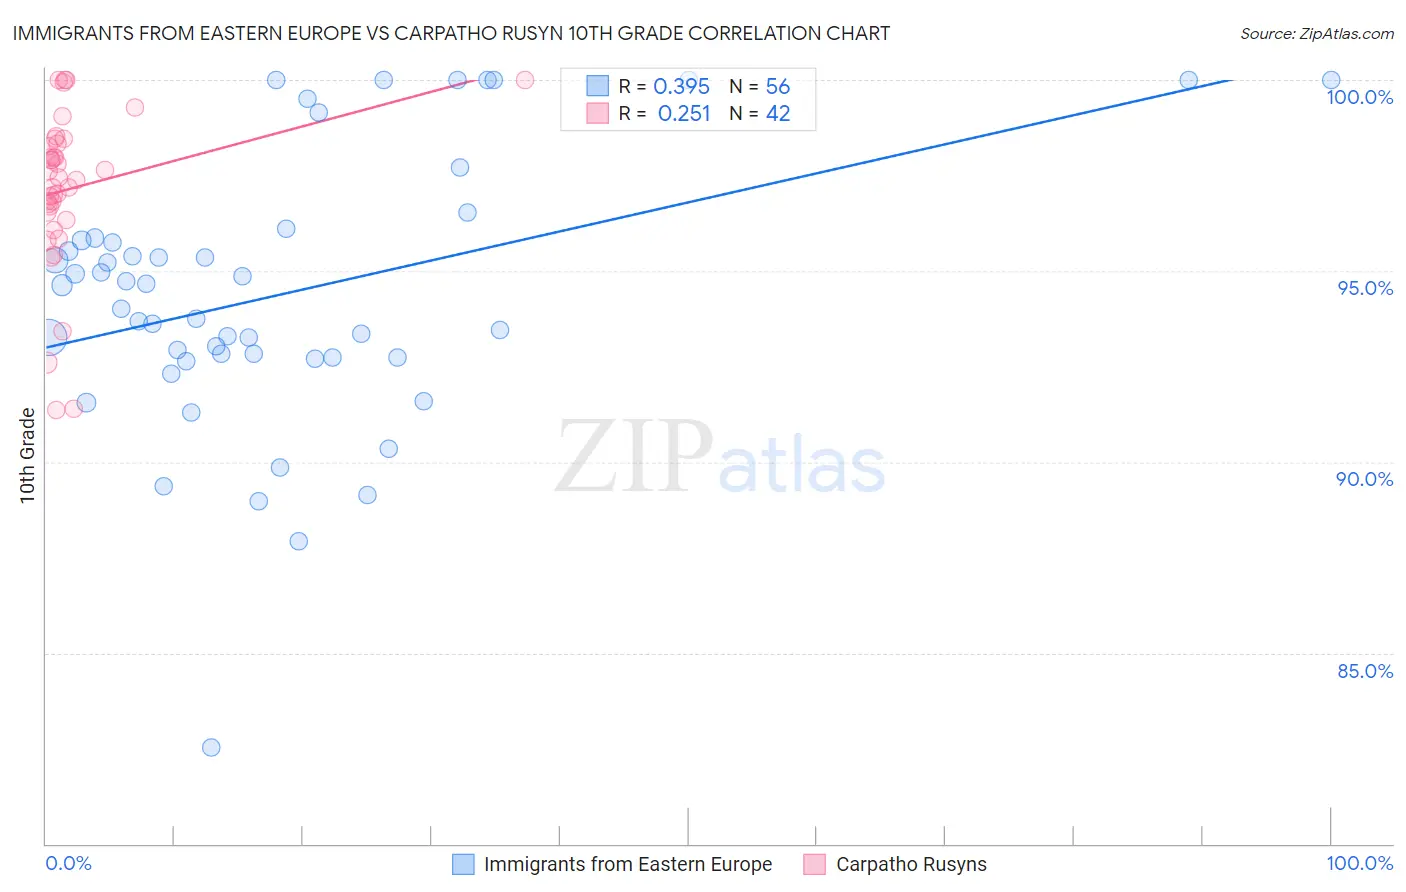
Immigrants from Eastern Europe vs Carpatho Rusyn 10th Grade Correlation Chart

The statistical analysis conducted on geographies consisting of 475,879,420 people shows a mild positive correlation between the proportion of Immigrants from Eastern Europe and percentage of population with at least 10th grade education in the United States with a correlation coefficient (R) of 0.395 and weighted average of 94.3%. Similarly, the statistical analysis conducted on geographies consisting of 58,871,690 people shows a weak positive correlation between the proportion of Carpatho Rusyns and percentage of population with at least 10th grade education in the United States with a correlation coefficient (R) of 0.251 and weighted average of 95.9%, a difference of 1.8%.
Immigrants from Eastern Europe vs Carpatho Rusyn 10th Grade

10th Grade Correlation Summary

MeasurementImmigrants from Eastern EuropeCarpatho Rusyn
Minimum82.5%91.4%
Maximum100.0%100.0%
Range17.5%8.6%
Mean94.4%97.2%
Median94.3%97.4%
Interquartile 25% (IQ1)92.7%96.5%
Interquartile 75% (IQ3)95.8%98.3%
Interquartile Range (IQR)3.1%1.8%
Standard Deviation (Sample)3.5%2.1%
Standard Deviation (Population)3.5%2.0%

Similar Demographics by 10th Grade

Demographics Similar to Immigrants from Eastern Europe by 10th Grade

In terms of 10th grade, the demographic groups most similar to Immigrants from Eastern Europe are Iroquois (94.3%, a difference of 0.010%), Immigrants from Greece (94.3%, a difference of 0.010%), Immigrants from Russia (94.3%, a difference of 0.010%), Creek (94.2%, a difference of 0.020%), and Osage (94.2%, a difference of 0.030%).
DemographicsRating | Rank10th Grade
Basques
94.9
/100
|
#124
Exceptional
94.3%
Americans
94.4
/100
|
#125
Exceptional
94.3%
Immigrants | Iran
94.4
/100
|
#126
Exceptional
94.3%
Israelis
93.8
/100
|
#127
Exceptional
94.3%
Potawatomi
93.6
/100
|
#128
Exceptional
94.3%
Iroquois
92.8
/100
|
#129
Exceptional
94.3%
Immigrants | Greece
92.7
/100
|
#130
Exceptional
94.3%
Immigrants | Eastern Europe
92.5
/100
|
#131
Exceptional
94.3%
Immigrants | Russia
92.4
/100
|
#132
Exceptional
94.3%
Creek
91.9
/100
|
#133
Exceptional
94.2%
Osage
91.7
/100
|
#134
Exceptional
94.2%
Immigrants | Korea
91.3
/100
|
#135
Exceptional
94.2%
Shoshone
90.8
/100
|
#136
Exceptional
94.2%
Arapaho
90.5
/100
|
#137
Exceptional
94.2%
Immigrants | Sri Lanka
89.9
/100
|
#138
Excellent
94.2%

Demographics Similar to Carpatho Rusyns by 10th Grade

In terms of 10th grade, the demographic groups most similar to Carpatho Rusyns are Slovene (95.9%, a difference of 0.020%), Swedish (95.9%, a difference of 0.020%), Polish (95.8%, a difference of 0.10%), German (95.8%, a difference of 0.11%), and Slovak (96.0%, a difference of 0.12%).
DemographicsRating | Rank10th Grade
Norwegians
100.0
/100
|
#1
Exceptional
96.2%
Slovaks
100.0
/100
|
#2
Exceptional
96.0%
Slovenes
100.0
/100
|
#3
Exceptional
95.9%
Swedes
100.0
/100
|
#4
Exceptional
95.9%
Carpatho Rusyns
100.0
/100
|
#5
Exceptional
95.9%
Poles
100.0
/100
|
#6
Exceptional
95.8%
Germans
100.0
/100
|
#7
Exceptional
95.8%
Lithuanians
100.0
/100
|
#8
Exceptional
95.8%
Finns
100.0
/100
|
#9
Exceptional
95.8%
Croatians
100.0
/100
|
#10
Exceptional
95.7%
Danes
100.0
/100
|
#11
Exceptional
95.7%
Tlingit-Haida
100.0
/100
|
#12
Exceptional
95.7%
English
100.0
/100
|
#13
Exceptional
95.6%
Tsimshian
100.0
/100
|
#14
Exceptional
95.6%
Irish
100.0
/100
|
#15
Exceptional
95.6%