Immigrants from Cameroon vs Laotian 6th Grade

COMPARE

Immigrants from Cameroon
Race
Ancestry
AfghanAfricanAlaska NativeAlaskan AthabascanAlbanianAleutAlsatianAmericanApacheArabArapahoArgentineanArmenianAssyrian/Chaldean/SyriacAustralianAustrianBahamianBangladeshiBarbadianBasqueBelgianBelizeanBermudanBhutaneseBlackfeetBolivianBrazilianBritishBritish West IndianBulgarianBurmeseCajunCambodianCanadianCape VerdeanCarpatho RusynCelticCentral AmericanCentral American IndianCherokeeCheyenneChickasawChileanChineseChippewaChoctawColombianColvilleComancheCosta RicanCreeCreekCroatianCrowCubanCypriotCzechCzechoslovakianDanishDelawareDominicanDutchDutch West IndianEastern EuropeanEcuadorianEgyptianEnglishEstonianEthiopianEuropeanFijianFilipinoFinnishFrenchFrench American IndianFrench CanadianGermanGerman RussianGhanaianGreekGuamanian/ChamorroGuatemalanGuyaneseHaitianHmongHonduranHopiHoumaHungarianIcelanderIndian (Asian)IndonesianInupiatIranianIraqiIrishIroquoisIsraeliItalianJamaicanJapaneseJordanianKenyanKiowaKoreanLatvianLebaneseLiberianLithuanianLumbeeLuxembourgerMacedonianMalaysianMalteseMarshalleseMenomineeMexicanMexican American IndianMongolianMoroccanNative HawaiianNavajoNepaleseNew ZealanderNicaraguanNigerianNorthern EuropeanNorwegianOkinawanOsageOttawaPaiutePakistaniPalestinianPanamanianParaguayanPennsylvania GermanPeruvianPimaPolishPortuguesePotawatomiPuebloPuerto RicanPuget Sound SalishRomanianRussianSalvadoranSamoanScandinavianScotch-IrishScottishSeminoleSenegaleseSerbianShoshoneSierra LeoneanSiouxSlavicSlovakSloveneSomaliSouth AfricanSouth AmericanSouth American IndianSoviet UnionSpaniardSpanishSpanish AmericanSpanish American IndianSri LankanSubsaharan AfricanSudaneseSwedishSwissSyrianTaiwaneseThaiTlingit-HaidaTohono O'OdhamTonganTrinidadian and TobagonianTsimshianTurkishU.S. Virgin IslanderUgandanUkrainianUruguayanUteVenezuelanVietnameseWelshWest IndianYakamaYaquiYugoslavianYumanYup'ikZimbabwean
Immigration
NonimmigrantsImmigrantsAfghanistanAfricaAlbaniaArgentinaArmeniaAsiaAustraliaAustriaBahamasBangladeshBarbadosBelarusBelgiumBelizeBoliviaBosnia and HerzegovinaBrazilBulgariaBurma/MyanmarCabo VerdeCambodiaCameroonCanadaCaribbeanCentral AmericaChileChinaColombiaCongoCosta RicaCroatiaCubaCzechoslovakiaDenmarkDominicaDominican RepublicEastern AfricaEastern AsiaEastern EuropeEcuadorEgyptEl SalvadorEnglandEritreaEthiopiaEuropeFijiFranceGermanyGhanaGreeceGrenadaGuatemalaGuyanaHaitiHondurasHong KongHungaryIndiaIndonesiaIranIraqIrelandIsraelItalyJamaicaJapanJordanKazakhstanKenyaKoreaKuwaitLaosLatin AmericaLatviaLebanonLiberiaLithuaniaMalaysiaMexicoMicronesiaMiddle AfricaMoldovaMoroccoNepalNetherlandsNicaraguaNigeriaNorth AmericaNorth MacedoniaNorthern AfricaNorthern EuropeNorwayOceaniaPakistanPanamaPeruPhilippinesPolandPortugalRomaniaRussiaSaudi ArabiaScotlandSenegalSerbiaSierra LeoneSingaporeSomaliaSouth AfricaSouth AmericaSouth Central AsiaSouth Eastern AsiaSouthern EuropeSpainSri LankaSt. Vincent and the GrenadinesSudanSwedenSwitzerlandSyriaTaiwanThailandTrinidad and TobagoTurkeyUgandaUkraineUruguayUzbekistanVenezuelaVietnamWest IndiesWestern AfricaWestern AsiaWestern EuropeYemenZaireZimbabweAzores
Laotian
Race
Ancestry
AfghanAfricanAlaska NativeAlaskan AthabascanAlbanianAleutAlsatianAmericanApacheArabArapahoArgentineanArmenianAssyrian/Chaldean/SyriacAustralianAustrianBahamianBangladeshiBarbadianBasqueBelgianBelizeanBermudanBhutaneseBlackfeetBolivianBrazilianBritishBritish West IndianBulgarianBurmeseCajunCambodianCanadianCape VerdeanCarpatho RusynCelticCentral AmericanCentral American IndianCherokeeCheyenneChickasawChileanChineseChippewaChoctawColombianColvilleComancheCosta RicanCreeCreekCroatianCrowCubanCypriotCzechCzechoslovakianDanishDelawareDominicanDutchDutch West IndianEastern EuropeanEcuadorianEgyptianEnglishEstonianEthiopianEuropeanFijianFilipinoFinnishFrenchFrench American IndianFrench CanadianGermanGerman RussianGhanaianGreekGuamanian/ChamorroGuatemalanGuyaneseHaitianHmongHonduranHopiHoumaHungarianIcelanderIndian (Asian)IndonesianInupiatIranianIraqiIrishIroquoisIsraeliItalianJamaicanJapaneseJordanianKenyanKiowaKoreanLaotianLatvianLebaneseLiberianLithuanianLumbeeLuxembourgerMacedonianMalaysianMalteseMarshalleseMenomineeMexicanMexican American IndianMongolianMoroccanNative HawaiianNavajoNepaleseNew ZealanderNicaraguanNigerianNorthern EuropeanNorwegianOkinawanOsageOttawaPaiutePakistaniPalestinianPanamanianParaguayanPennsylvania GermanPeruvianPimaPolishPortuguesePotawatomiPuebloPuerto RicanPuget Sound SalishRomanianRussianSalvadoranSamoanScandinavianScotch-IrishScottishSeminoleSenegaleseSerbianShoshoneSierra LeoneanSiouxSlavicSlovakSloveneSomaliSouth AfricanSouth AmericanSouth American IndianSoviet UnionSpaniardSpanishSpanish AmericanSpanish American IndianSri LankanSubsaharan AfricanSudaneseSwedishSwissSyrianTaiwaneseThaiTlingit-HaidaTohono O'OdhamTonganTrinidadian and TobagonianTsimshianTurkishU.S. Virgin IslanderUgandanUkrainianUruguayanUteVenezuelanVietnameseWelshWest IndianYakamaYaquiYugoslavianYumanYup'ikZimbabwean
Immigration
NonimmigrantsImmigrantsAfghanistanAfricaAlbaniaArgentinaArmeniaAsiaAustraliaAustriaBahamasBangladeshBarbadosBelarusBelgiumBelizeBoliviaBosnia and HerzegovinaBrazilBulgariaBurma/MyanmarCabo VerdeCambodiaCanadaCaribbeanCentral AmericaChileChinaColombiaCongoCosta RicaCroatiaCubaCzechoslovakiaDenmarkDominicaDominican RepublicEastern AfricaEastern AsiaEastern EuropeEcuadorEgyptEl SalvadorEnglandEritreaEthiopiaEuropeFijiFranceGermanyGhanaGreeceGrenadaGuatemalaGuyanaHaitiHondurasHong KongHungaryIndiaIndonesiaIranIraqIrelandIsraelItalyJamaicaJapanJordanKazakhstanKenyaKoreaKuwaitLaosLatin AmericaLatviaLebanonLiberiaLithuaniaMalaysiaMexicoMicronesiaMiddle AfricaMoldovaMoroccoNepalNetherlandsNicaraguaNigeriaNorth AmericaNorth MacedoniaNorthern AfricaNorthern EuropeNorwayOceaniaPakistanPanamaPeruPhilippinesPolandPortugalRomaniaRussiaSaudi ArabiaScotlandSenegalSerbiaSierra LeoneSingaporeSomaliaSouth AfricaSouth AmericaSouth Central AsiaSouth Eastern AsiaSouthern EuropeSpainSri LankaSt. Vincent and the GrenadinesSudanSwedenSwitzerlandSyriaTaiwanThailandTrinidad and TobagoTurkeyUgandaUkraineUruguayUzbekistanVenezuelaVietnamWest IndiesWestern AfricaWestern AsiaWestern EuropeYemenZaireZimbabweAzores
6th Grade
Income
Poverty
Unemployment
Labor Participation
Family Structure
Vehicle Availability
Education Level
Disability

6th Grade Comparison

Immigrants from Cameroon

Laotians

Tragic
Poor
96.3%
6TH GRADE
0.1/ 100
METRIC RATING
273rd/ 347
METRIC RANK
96.8%
6TH GRADE
11.8/ 100
METRIC RATING
206th/ 347
METRIC RANK

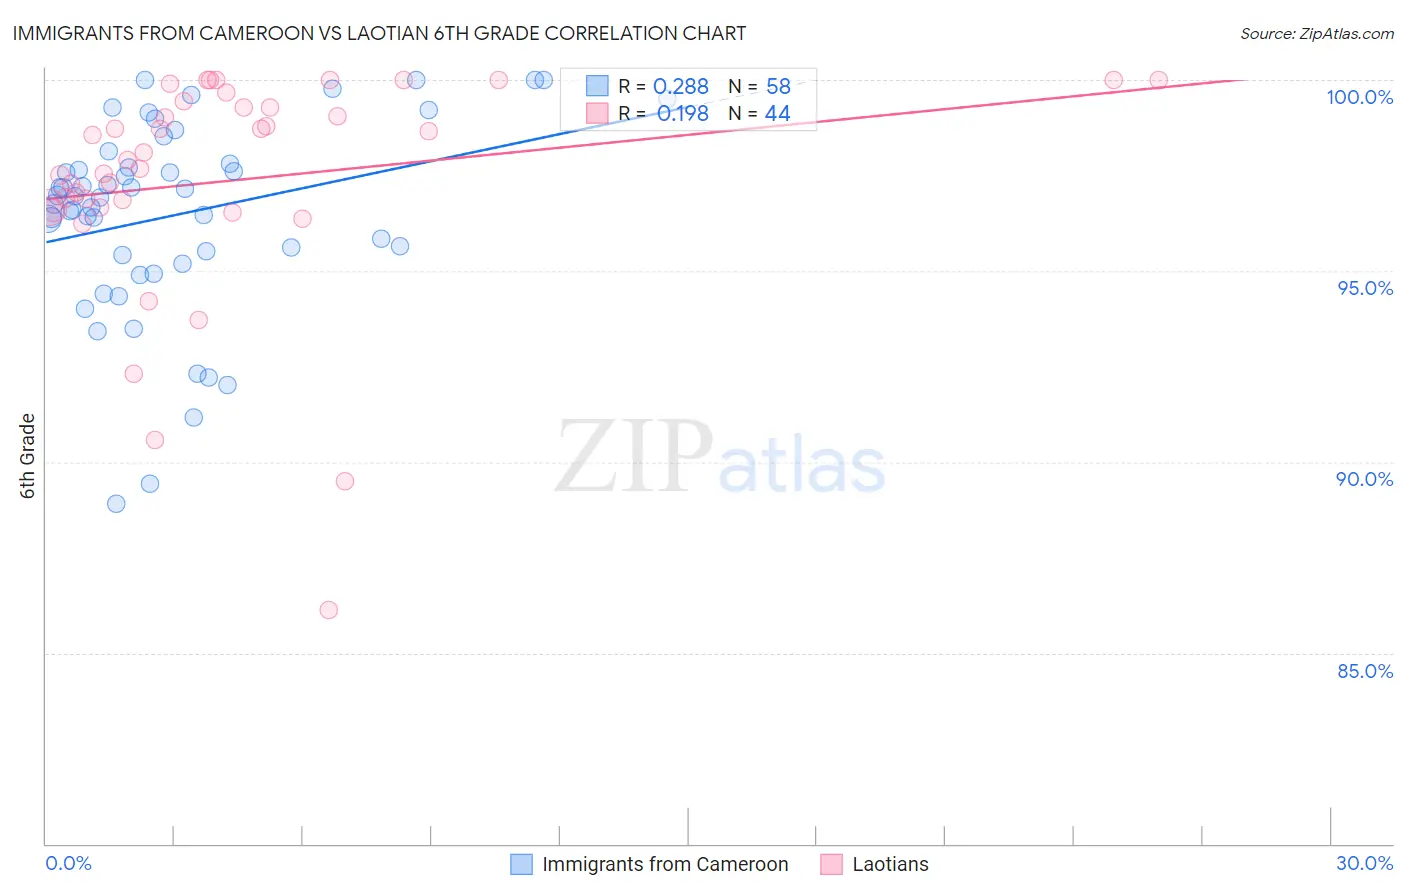
Immigrants from Cameroon vs Laotian 6th Grade Correlation Chart

The statistical analysis conducted on geographies consisting of 130,752,798 people shows a weak positive correlation between the proportion of Immigrants from Cameroon and percentage of population with at least 6th grade education in the United States with a correlation coefficient (R) of 0.288 and weighted average of 96.3%. Similarly, the statistical analysis conducted on geographies consisting of 224,856,650 people shows a poor positive correlation between the proportion of Laotians and percentage of population with at least 6th grade education in the United States with a correlation coefficient (R) of 0.198 and weighted average of 96.8%, a difference of 0.55%.
Immigrants from Cameroon vs Laotian 6th Grade

6th Grade Correlation Summary

MeasurementImmigrants from CameroonLaotian
Minimum88.9%86.1%
Maximum100.0%100.0%
Range11.1%13.9%
Mean96.5%97.4%
Median96.9%98.0%
Interquartile 25% (IQ1)95.4%96.6%
Interquartile 75% (IQ3)97.8%99.4%
Interquartile Range (IQR)2.4%2.7%
Standard Deviation (Sample)2.5%3.0%
Standard Deviation (Population)2.5%3.0%

Similar Demographics by 6th Grade

Demographics Similar to Immigrants from Cameroon by 6th Grade

In terms of 6th grade, the demographic groups most similar to Immigrants from Cameroon are Immigrants from Philippines (96.3%, a difference of 0.0%), Immigrants from Bolivia (96.3%, a difference of 0.010%), Immigrants from Ghana (96.3%, a difference of 0.010%), Yaqui (96.3%, a difference of 0.020%), and Immigrants from Western Africa (96.3%, a difference of 0.030%).
DemographicsRating | Rank6th Grade
Ghanaians
0.2
/100
|
#266
Tragic
96.4%
Afghans
0.2
/100
|
#267
Tragic
96.4%
Immigrants | Uzbekistan
0.2
/100
|
#268
Tragic
96.3%
West Indians
0.2
/100
|
#269
Tragic
96.3%
Immigrants | South America
0.2
/100
|
#270
Tragic
96.3%
Immigrants | Hong Kong
0.2
/100
|
#271
Tragic
96.3%
Immigrants | Bolivia
0.1
/100
|
#272
Tragic
96.3%
Immigrants | Cameroon
0.1
/100
|
#273
Tragic
96.3%
Immigrants | Philippines
0.1
/100
|
#274
Tragic
96.3%
Immigrants | Ghana
0.1
/100
|
#275
Tragic
96.3%
Yaqui
0.1
/100
|
#276
Tragic
96.3%
Immigrants | Western Africa
0.1
/100
|
#277
Tragic
96.3%
Immigrants | Thailand
0.1
/100
|
#278
Tragic
96.3%
Immigrants | Peru
0.1
/100
|
#279
Tragic
96.2%
Immigrants | Afghanistan
0.1
/100
|
#280
Tragic
96.2%

Demographics Similar to Laotians by 6th Grade

In terms of 6th grade, the demographic groups most similar to Laotians are Iraqi (96.8%, a difference of 0.0%), Native/Alaskan (96.8%, a difference of 0.010%), Samoan (96.8%, a difference of 0.010%), Immigrants from Oceania (96.8%, a difference of 0.010%), and Immigrants from Chile (96.8%, a difference of 0.020%).
DemographicsRating | Rank6th Grade
Immigrants | Northern Africa
15.7
/100
|
#199
Poor
96.9%
Africans
14.8
/100
|
#200
Poor
96.9%
Immigrants | Zaire
14.5
/100
|
#201
Poor
96.9%
Immigrants | Chile
14.2
/100
|
#202
Poor
96.8%
Sudanese
13.9
/100
|
#203
Poor
96.8%
Immigrants | Bahamas
13.8
/100
|
#204
Poor
96.8%
Natives/Alaskans
13.0
/100
|
#205
Poor
96.8%
Laotians
11.8
/100
|
#206
Poor
96.8%
Iraqis
11.7
/100
|
#207
Poor
96.8%
Samoans
11.0
/100
|
#208
Poor
96.8%
Immigrants | Oceania
11.0
/100
|
#209
Poor
96.8%
Immigrants | Nepal
10.1
/100
|
#210
Poor
96.8%
Immigrants | Iraq
9.2
/100
|
#211
Tragic
96.8%
Moroccans
9.0
/100
|
#212
Tragic
96.8%
Immigrants | Sudan
8.7
/100
|
#213
Tragic
96.8%