Colombian vs Apache 1st Grade
COMPARE
Colombian
Apache
1st Grade
1st Grade Comparison
Colombians
Apache
97.6%
1ST GRADE
2.2/ 100
METRIC RATING
234th/ 347
METRIC RANK
98.0%
1ST GRADE
75.2/ 100
METRIC RATING
148th/ 347
METRIC RANK
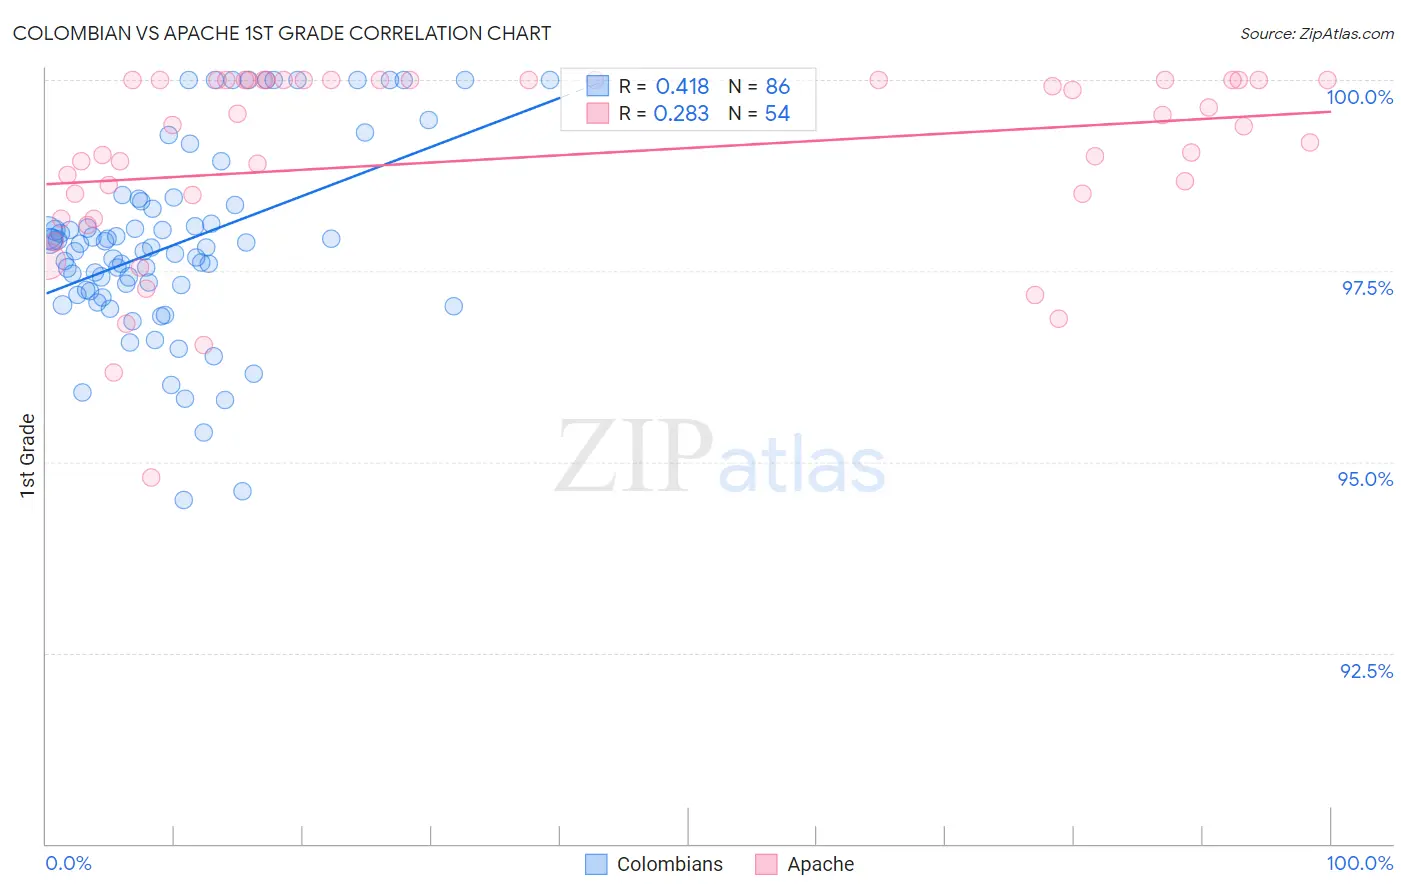
Colombian vs Apache 1st Grade Correlation Chart
The statistical analysis conducted on geographies consisting of 419,700,680 people shows a moderate positive correlation between the proportion of Colombians and percentage of population with at least 1st grade education in the United States with a correlation coefficient (R) of 0.418 and weighted average of 97.6%. Similarly, the statistical analysis conducted on geographies consisting of 231,142,814 people shows a weak positive correlation between the proportion of Apache and percentage of population with at least 1st grade education in the United States with a correlation coefficient (R) of 0.283 and weighted average of 98.0%, a difference of 0.38%.
1st Grade Correlation Summary
| Measurement | Colombian | Apache |
| Minimum | 94.5% | 94.8% |
| Maximum | 100.0% | 100.0% |
| Range | 5.5% | 5.2% |
| Mean | 97.8% | 99.0% |
| Median | 97.8% | 99.4% |
| Interquartile 25% (IQ1) | 97.2% | 98.5% |
| Interquartile 75% (IQ3) | 98.4% | 100.0% |
| Interquartile Range (IQR) | 1.1% | 1.5% |
| Standard Deviation (Sample) | 1.2% | 1.2% |
| Standard Deviation (Population) | 1.2% | 1.2% |
Similar Demographics by 1st Grade
Demographics Similar to Colombians by 1st Grade
In terms of 1st grade, the demographic groups most similar to Colombians are Immigrants from Pakistan (97.6%, a difference of 0.0%), Immigrants from Malaysia (97.6%, a difference of 0.0%), Immigrants from Western Asia (97.6%, a difference of 0.0%), Immigrants from Uruguay (97.6%, a difference of 0.010%), and U.S. Virgin Islander (97.6%, a difference of 0.010%).
| Demographics | Rating | Rank | 1st Grade |
| Sierra Leoneans | 3.6 /100 | #227 | Tragic 97.7% |
| Sub-Saharan Africans | 3.6 /100 | #228 | Tragic 97.7% |
| Immigrants | Costa Rica | 3.5 /100 | #229 | Tragic 97.7% |
| Senegalese | 3.5 /100 | #230 | Tragic 97.7% |
| Puerto Ricans | 3.0 /100 | #231 | Tragic 97.7% |
| Immigrants | Uruguay | 2.5 /100 | #232 | Tragic 97.6% |
| Immigrants | Pakistan | 2.2 /100 | #233 | Tragic 97.6% |
| Colombians | 2.2 /100 | #234 | Tragic 97.6% |
| Immigrants | Malaysia | 2.1 /100 | #235 | Tragic 97.6% |
| Immigrants | Western Asia | 2.1 /100 | #236 | Tragic 97.6% |
| U.S. Virgin Islanders | 1.9 /100 | #237 | Tragic 97.6% |
| Nigerians | 1.8 /100 | #238 | Tragic 97.6% |
| Immigrants | Eastern Asia | 1.6 /100 | #239 | Tragic 97.6% |
| Koreans | 1.5 /100 | #240 | Tragic 97.6% |
| Liberians | 1.4 /100 | #241 | Tragic 97.6% |
Demographics Similar to Apache by 1st Grade
In terms of 1st grade, the demographic groups most similar to Apache are Immigrants from Greece (98.0%, a difference of 0.0%), Immigrants from Israel (98.0%, a difference of 0.010%), Filipino (98.0%, a difference of 0.010%), Jordanian (98.0%, a difference of 0.010%), and Hmong (98.0%, a difference of 0.020%).
| Demographics | Rating | Rank | 1st Grade |
| Immigrants | Turkey | 82.8 /100 | #141 | Excellent 98.0% |
| Marshallese | 82.0 /100 | #142 | Excellent 98.0% |
| Burmese | 81.0 /100 | #143 | Excellent 98.0% |
| Alsatians | 80.9 /100 | #144 | Excellent 98.0% |
| Hmong | 79.0 /100 | #145 | Good 98.0% |
| Immigrants | Israel | 77.8 /100 | #146 | Good 98.0% |
| Filipinos | 77.6 /100 | #147 | Good 98.0% |
| Apache | 75.2 /100 | #148 | Good 98.0% |
| Immigrants | Greece | 74.9 /100 | #149 | Good 98.0% |
| Jordanians | 72.7 /100 | #150 | Good 98.0% |
| Dutch West Indians | 69.8 /100 | #151 | Good 98.0% |
| Immigrants | Moldova | 69.5 /100 | #152 | Good 98.0% |
| Soviet Union | 68.9 /100 | #153 | Good 98.0% |
| Immigrants | Iran | 66.9 /100 | #154 | Good 98.0% |
| Comanche | 66.9 /100 | #155 | Good 98.0% |