Immigrants from Bulgaria vs Venezuelan 1st Grade
COMPARE
Immigrants from Bulgaria
Venezuelan
1st Grade
1st Grade Comparison
Immigrants from Bulgaria
Venezuelans
98.1%
1ST GRADE
88.8/ 100
METRIC RATING
136th/ 347
METRIC RANK
98.0%
1ST GRADE
64.7/ 100
METRIC RATING
158th/ 347
METRIC RANK
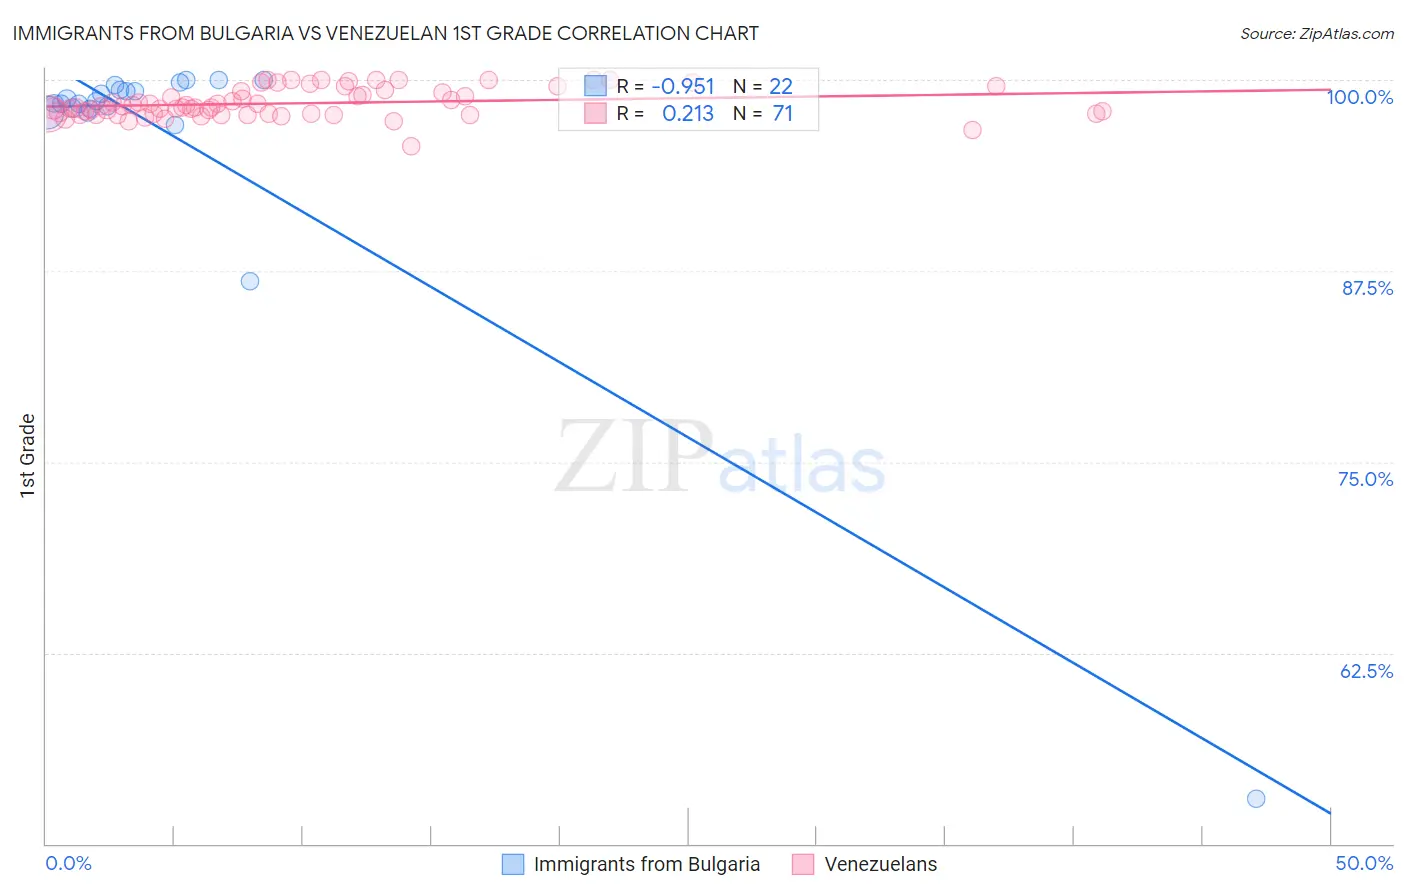
Immigrants from Bulgaria vs Venezuelan 1st Grade Correlation Chart
The statistical analysis conducted on geographies consisting of 172,552,181 people shows a perfect negative correlation between the proportion of Immigrants from Bulgaria and percentage of population with at least 1st grade education in the United States with a correlation coefficient (R) of -0.951 and weighted average of 98.1%. Similarly, the statistical analysis conducted on geographies consisting of 306,323,638 people shows a weak positive correlation between the proportion of Venezuelans and percentage of population with at least 1st grade education in the United States with a correlation coefficient (R) of 0.213 and weighted average of 98.0%, a difference of 0.11%.
1st Grade Correlation Summary
| Measurement | Immigrants from Bulgaria | Venezuelan |
| Minimum | 52.9% | 95.6% |
| Maximum | 100.0% | 100.0% |
| Range | 47.1% | 4.4% |
| Mean | 96.2% | 98.5% |
| Median | 98.5% | 98.2% |
| Interquartile 25% (IQ1) | 98.1% | 97.8% |
| Interquartile 75% (IQ3) | 99.4% | 99.2% |
| Interquartile Range (IQR) | 1.2% | 1.4% |
| Standard Deviation (Sample) | 10.0% | 0.94% |
| Standard Deviation (Population) | 9.8% | 0.93% |
Similar Demographics by 1st Grade
Demographics Similar to Immigrants from Bulgaria by 1st Grade
In terms of 1st grade, the demographic groups most similar to Immigrants from Bulgaria are Immigrants from Hungary (98.1%, a difference of 0.0%), Immigrants from Kuwait (98.1%, a difference of 0.0%), Immigrants from Europe (98.1%, a difference of 0.010%), Israeli (98.1%, a difference of 0.010%), and Immigrants from Romania (98.1%, a difference of 0.010%).
| Demographics | Rating | Rank | 1st Grade |
| Seminole | 91.9 /100 | #129 | Exceptional 98.1% |
| Immigrants | Croatia | 91.4 /100 | #130 | Exceptional 98.1% |
| Spaniards | 91.2 /100 | #131 | Exceptional 98.1% |
| Cambodians | 90.9 /100 | #132 | Exceptional 98.1% |
| Immigrants | Europe | 90.5 /100 | #133 | Exceptional 98.1% |
| Immigrants | Hungary | 89.4 /100 | #134 | Excellent 98.1% |
| Immigrants | Kuwait | 89.3 /100 | #135 | Excellent 98.1% |
| Immigrants | Bulgaria | 88.8 /100 | #136 | Excellent 98.1% |
| Israelis | 87.8 /100 | #137 | Excellent 98.1% |
| Immigrants | Romania | 87.8 /100 | #138 | Excellent 98.1% |
| Blackfeet | 87.6 /100 | #139 | Excellent 98.1% |
| Palestinians | 83.0 /100 | #140 | Excellent 98.0% |
| Immigrants | Turkey | 82.8 /100 | #141 | Excellent 98.0% |
| Marshallese | 82.0 /100 | #142 | Excellent 98.0% |
| Burmese | 81.0 /100 | #143 | Excellent 98.0% |
Demographics Similar to Venezuelans by 1st Grade
In terms of 1st grade, the demographic groups most similar to Venezuelans are Immigrants from North Macedonia (98.0%, a difference of 0.0%), French American Indian (98.0%, a difference of 0.0%), Soviet Union (98.0%, a difference of 0.010%), Immigrants from Iran (98.0%, a difference of 0.010%), and Comanche (98.0%, a difference of 0.010%).
| Demographics | Rating | Rank | 1st Grade |
| Dutch West Indians | 69.8 /100 | #151 | Good 98.0% |
| Immigrants | Moldova | 69.5 /100 | #152 | Good 98.0% |
| Soviet Union | 68.9 /100 | #153 | Good 98.0% |
| Immigrants | Iran | 66.9 /100 | #154 | Good 98.0% |
| Comanche | 66.9 /100 | #155 | Good 98.0% |
| Immigrants | South Central Asia | 66.2 /100 | #156 | Good 98.0% |
| Immigrants | North Macedonia | 65.3 /100 | #157 | Good 98.0% |
| Venezuelans | 64.7 /100 | #158 | Good 98.0% |
| French American Indians | 63.7 /100 | #159 | Good 98.0% |
| Immigrants | Russia | 59.2 /100 | #160 | Average 97.9% |
| Immigrants | Italy | 59.1 /100 | #161 | Average 97.9% |
| Immigrants | Eastern Europe | 58.9 /100 | #162 | Average 97.9% |
| Spanish Americans | 57.7 /100 | #163 | Average 97.9% |
| Brazilians | 57.6 /100 | #164 | Average 97.9% |
| Ugandans | 56.9 /100 | #165 | Average 97.9% |