Immigrants from Brazil vs Immigrants from Bangladesh 9th Grade
COMPARE
Immigrants from Brazil
Immigrants from Bangladesh
9th Grade
9th Grade Comparison
Immigrants from Brazil
Immigrants from Bangladesh
95.0%
9TH GRADE
61.1/ 100
METRIC RATING
167th/ 347
METRIC RANK
92.4%
9TH GRADE
0.0/ 100
METRIC RATING
309th/ 347
METRIC RANK
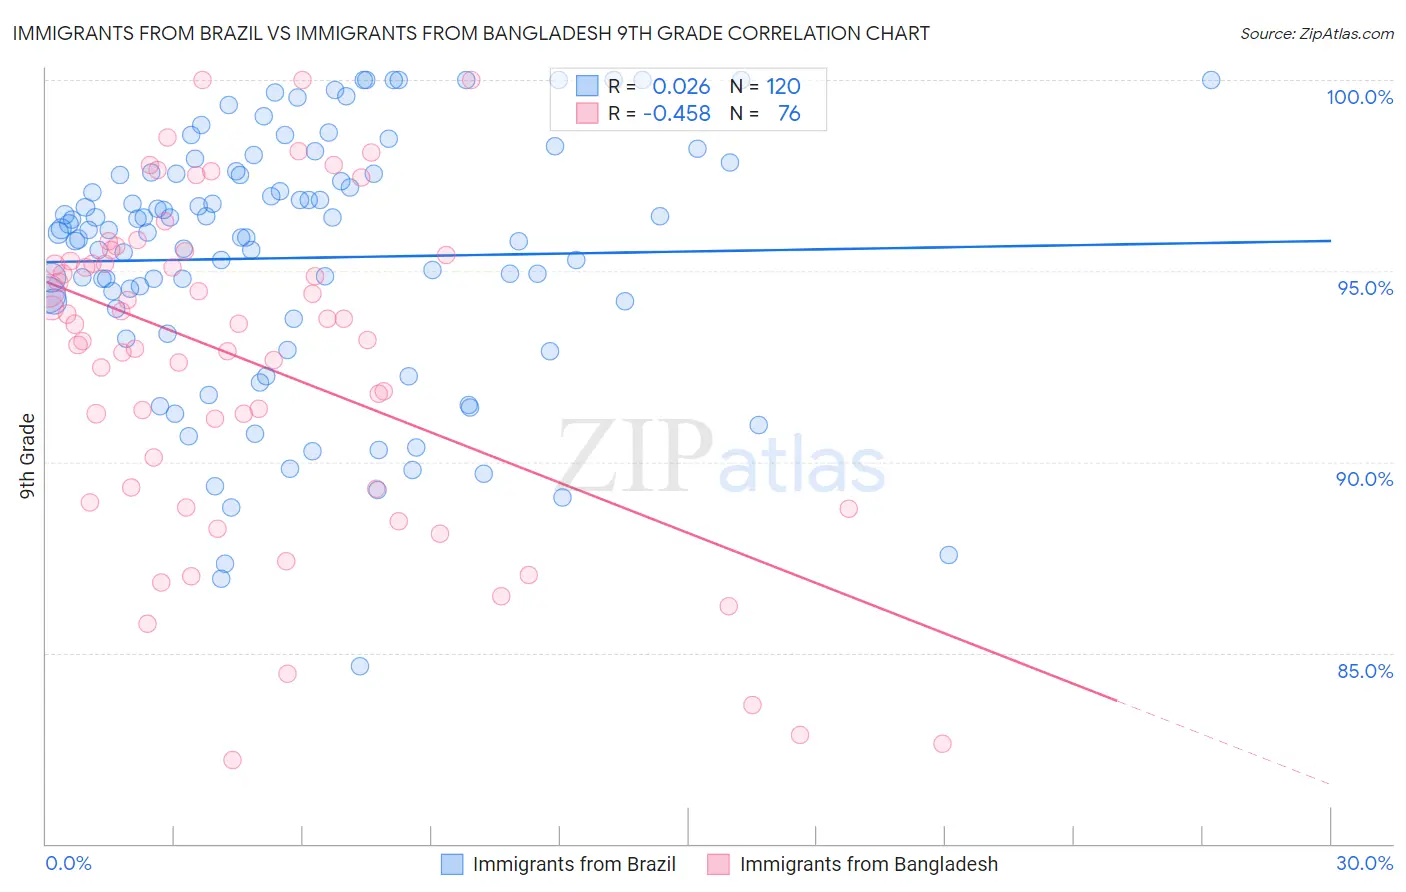
Immigrants from Brazil vs Immigrants from Bangladesh 9th Grade Correlation Chart
The statistical analysis conducted on geographies consisting of 342,965,001 people shows no correlation between the proportion of Immigrants from Brazil and percentage of population with at least 9th grade education in the United States with a correlation coefficient (R) of 0.026 and weighted average of 95.0%. Similarly, the statistical analysis conducted on geographies consisting of 203,672,706 people shows a moderate negative correlation between the proportion of Immigrants from Bangladesh and percentage of population with at least 9th grade education in the United States with a correlation coefficient (R) of -0.458 and weighted average of 92.4%, a difference of 2.8%.
9th Grade Correlation Summary
| Measurement | Immigrants from Brazil | Immigrants from Bangladesh |
| Minimum | 84.7% | 82.2% |
| Maximum | 100.0% | 100.0% |
| Range | 15.3% | 17.8% |
| Mean | 95.3% | 92.6% |
| Median | 96.0% | 93.6% |
| Interquartile 25% (IQ1) | 93.9% | 89.3% |
| Interquartile 75% (IQ3) | 97.5% | 95.3% |
| Interquartile Range (IQR) | 3.7% | 6.0% |
| Standard Deviation (Sample) | 3.3% | 4.3% |
| Standard Deviation (Population) | 3.3% | 4.3% |
Similar Demographics by 9th Grade
Demographics Similar to Immigrants from Brazil by 9th Grade
In terms of 9th grade, the demographic groups most similar to Immigrants from Brazil are Chilean (95.0%, a difference of 0.0%), Blackfeet (95.0%, a difference of 0.010%), Ute (95.0%, a difference of 0.010%), Spaniard (94.9%, a difference of 0.010%), and Pakistani (95.0%, a difference of 0.020%).
| Demographics | Rating | Rank | 9th Grade |
| Immigrants | Italy | 66.6 /100 | #160 | Good 95.0% |
| French American Indians | 66.5 /100 | #161 | Good 95.0% |
| Bermudans | 65.8 /100 | #162 | Good 95.0% |
| Pakistanis | 64.1 /100 | #163 | Good 95.0% |
| Venezuelans | 63.6 /100 | #164 | Good 95.0% |
| Blackfeet | 62.6 /100 | #165 | Good 95.0% |
| Ute | 62.6 /100 | #166 | Good 95.0% |
| Immigrants | Brazil | 61.1 /100 | #167 | Good 95.0% |
| Chileans | 60.7 /100 | #168 | Good 95.0% |
| Spaniards | 59.6 /100 | #169 | Average 94.9% |
| Alsatians | 58.6 /100 | #170 | Average 94.9% |
| Colville | 58.5 /100 | #171 | Average 94.9% |
| Iraqis | 54.0 /100 | #172 | Average 94.9% |
| Cheyenne | 51.5 /100 | #173 | Average 94.9% |
| Immigrants | Egypt | 50.0 /100 | #174 | Average 94.9% |
Demographics Similar to Immigrants from Bangladesh by 9th Grade
In terms of 9th grade, the demographic groups most similar to Immigrants from Bangladesh are Immigrants from Cambodia (92.4%, a difference of 0.030%), Immigrants from Fiji (92.3%, a difference of 0.050%), Houma (92.3%, a difference of 0.080%), Vietnamese (92.3%, a difference of 0.10%), and Immigrants from Portugal (92.2%, a difference of 0.14%).
| Demographics | Rating | Rank | 9th Grade |
| Immigrants | Dominica | 0.0 /100 | #302 | Tragic 92.7% |
| Guyanese | 0.0 /100 | #303 | Tragic 92.7% |
| Tohono O'odham | 0.0 /100 | #304 | Tragic 92.6% |
| Japanese | 0.0 /100 | #305 | Tragic 92.6% |
| Immigrants | Vietnam | 0.0 /100 | #306 | Tragic 92.6% |
| Immigrants | Immigrants | 0.0 /100 | #307 | Tragic 92.5% |
| Immigrants | Guyana | 0.0 /100 | #308 | Tragic 92.5% |
| Immigrants | Bangladesh | 0.0 /100 | #309 | Tragic 92.4% |
| Immigrants | Cambodia | 0.0 /100 | #310 | Tragic 92.4% |
| Immigrants | Fiji | 0.0 /100 | #311 | Tragic 92.3% |
| Houma | 0.0 /100 | #312 | Tragic 92.3% |
| Vietnamese | 0.0 /100 | #313 | Tragic 92.3% |
| Immigrants | Portugal | 0.0 /100 | #314 | Tragic 92.2% |
| Immigrants | Caribbean | 0.0 /100 | #315 | Tragic 92.2% |
| Cape Verdeans | 0.0 /100 | #316 | Tragic 92.2% |