Immigrants from Spain vs South American Nursery School
COMPARE
Immigrants from Spain
South American
Nursery School
Nursery School Comparison
Immigrants from Spain
South Americans
98.0%
NURSERY SCHOOL
55.6/ 100
METRIC RATING
167th/ 347
METRIC RANK
97.6%
NURSERY SCHOOL
1.0/ 100
METRIC RATING
244th/ 347
METRIC RANK
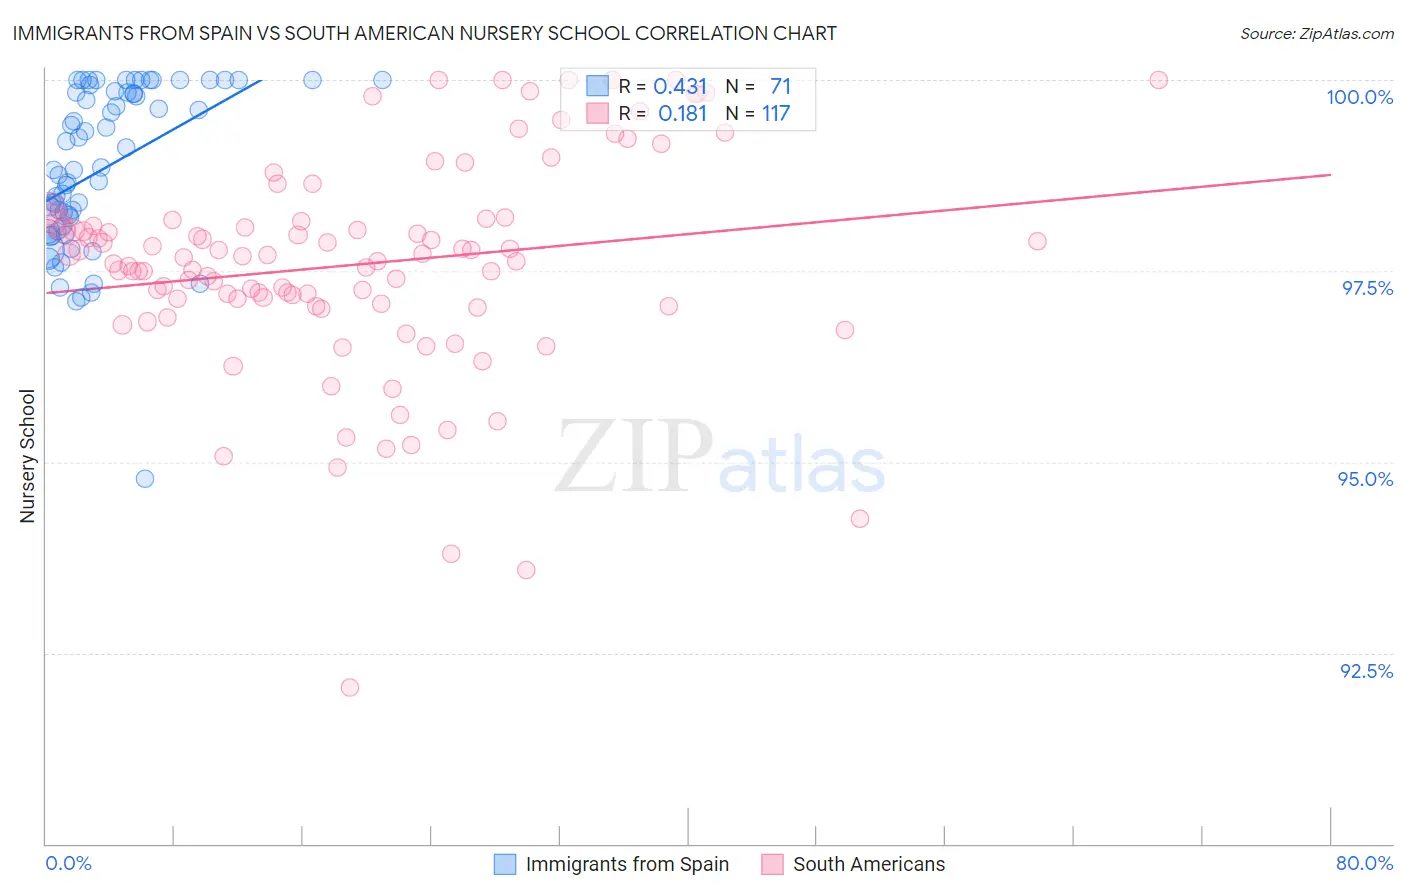
Immigrants from Spain vs South American Nursery School Correlation Chart
The statistical analysis conducted on geographies consisting of 239,682,160 people shows a moderate positive correlation between the proportion of Immigrants from Spain and percentage of population with at least nursery school education in the United States with a correlation coefficient (R) of 0.431 and weighted average of 98.0%. Similarly, the statistical analysis conducted on geographies consisting of 494,178,447 people shows a poor positive correlation between the proportion of South Americans and percentage of population with at least nursery school education in the United States with a correlation coefficient (R) of 0.181 and weighted average of 97.6%, a difference of 0.36%.
Nursery School Correlation Summary
| Measurement | Immigrants from Spain | South American |
| Minimum | 94.8% | 92.1% |
| Maximum | 100.0% | 100.0% |
| Range | 5.2% | 7.9% |
| Mean | 98.8% | 97.6% |
| Median | 98.8% | 97.7% |
| Interquartile 25% (IQ1) | 98.0% | 97.1% |
| Interquartile 75% (IQ3) | 99.8% | 98.2% |
| Interquartile Range (IQR) | 1.8% | 1.1% |
| Standard Deviation (Sample) | 1.1% | 1.4% |
| Standard Deviation (Population) | 1.1% | 1.4% |
Similar Demographics by Nursery School
Demographics Similar to Immigrants from Spain by Nursery School
In terms of nursery school, the demographic groups most similar to Immigrants from Spain are Ugandan (98.0%, a difference of 0.0%), Chilean (98.0%, a difference of 0.0%), Spanish American (98.0%, a difference of 0.0%), Immigrants from Micronesia (98.0%, a difference of 0.0%), and Immigrants from Russia (98.0%, a difference of 0.010%).
| Demographics | Rating | Rank | Nursery School |
| Immigrants | Russia | 59.9 /100 | #160 | Average 98.0% |
| Immigrants | Eastern Europe | 59.7 /100 | #161 | Average 98.0% |
| Brazilians | 59.4 /100 | #162 | Average 98.0% |
| Immigrants | Italy | 59.0 /100 | #163 | Average 98.0% |
| Ugandans | 56.4 /100 | #164 | Average 98.0% |
| Chileans | 56.4 /100 | #165 | Average 98.0% |
| Spanish Americans | 55.6 /100 | #166 | Average 98.0% |
| Immigrants | Spain | 55.6 /100 | #167 | Average 98.0% |
| Immigrants | Micronesia | 55.0 /100 | #168 | Average 98.0% |
| Immigrants | Korea | 53.8 /100 | #169 | Average 98.0% |
| Bermudans | 53.7 /100 | #170 | Average 98.0% |
| Immigrants | Jordan | 53.4 /100 | #171 | Average 98.0% |
| Immigrants | Brazil | 51.3 /100 | #172 | Average 98.0% |
| Kenyans | 50.2 /100 | #173 | Average 98.0% |
| Navajo | 50.0 /100 | #174 | Average 98.0% |
Demographics Similar to South Americans by Nursery School
In terms of nursery school, the demographic groups most similar to South Americans are Asian (97.6%, a difference of 0.0%), Bolivian (97.6%, a difference of 0.0%), Peruvian (97.6%, a difference of 0.0%), Immigrants from Indonesia (97.7%, a difference of 0.010%), and Liberian (97.7%, a difference of 0.010%).
| Demographics | Rating | Rank | Nursery School |
| Immigrants | Western Asia | 1.9 /100 | #237 | Tragic 97.7% |
| Nigerians | 1.7 /100 | #238 | Tragic 97.7% |
| Immigrants | Eastern Asia | 1.6 /100 | #239 | Tragic 97.7% |
| Koreans | 1.4 /100 | #240 | Tragic 97.7% |
| Immigrants | Indonesia | 1.1 /100 | #241 | Tragic 97.7% |
| Liberians | 1.1 /100 | #242 | Tragic 97.7% |
| Asians | 1.1 /100 | #243 | Tragic 97.6% |
| South Americans | 1.0 /100 | #244 | Tragic 97.6% |
| Bolivians | 1.0 /100 | #245 | Tragic 97.6% |
| Peruvians | 1.0 /100 | #246 | Tragic 97.6% |
| Immigrants | Middle Africa | 0.9 /100 | #247 | Tragic 97.6% |
| Indians (Asian) | 0.9 /100 | #248 | Tragic 97.6% |
| Immigrants | Eastern Africa | 0.9 /100 | #249 | Tragic 97.6% |
| Immigrants | Senegal | 0.9 /100 | #250 | Tragic 97.6% |
| Ethiopians | 0.8 /100 | #251 | Tragic 97.6% |