Immigrants from Belgium vs Irish 4th Grade
COMPARE
Immigrants from Belgium
Irish
4th Grade
4th Grade Comparison
Immigrants from Belgium
Irish
97.9%
4TH GRADE
99.0/ 100
METRIC RATING
83rd/ 347
METRIC RANK
98.4%
4TH GRADE
100.0/ 100
METRIC RATING
19th/ 347
METRIC RANK
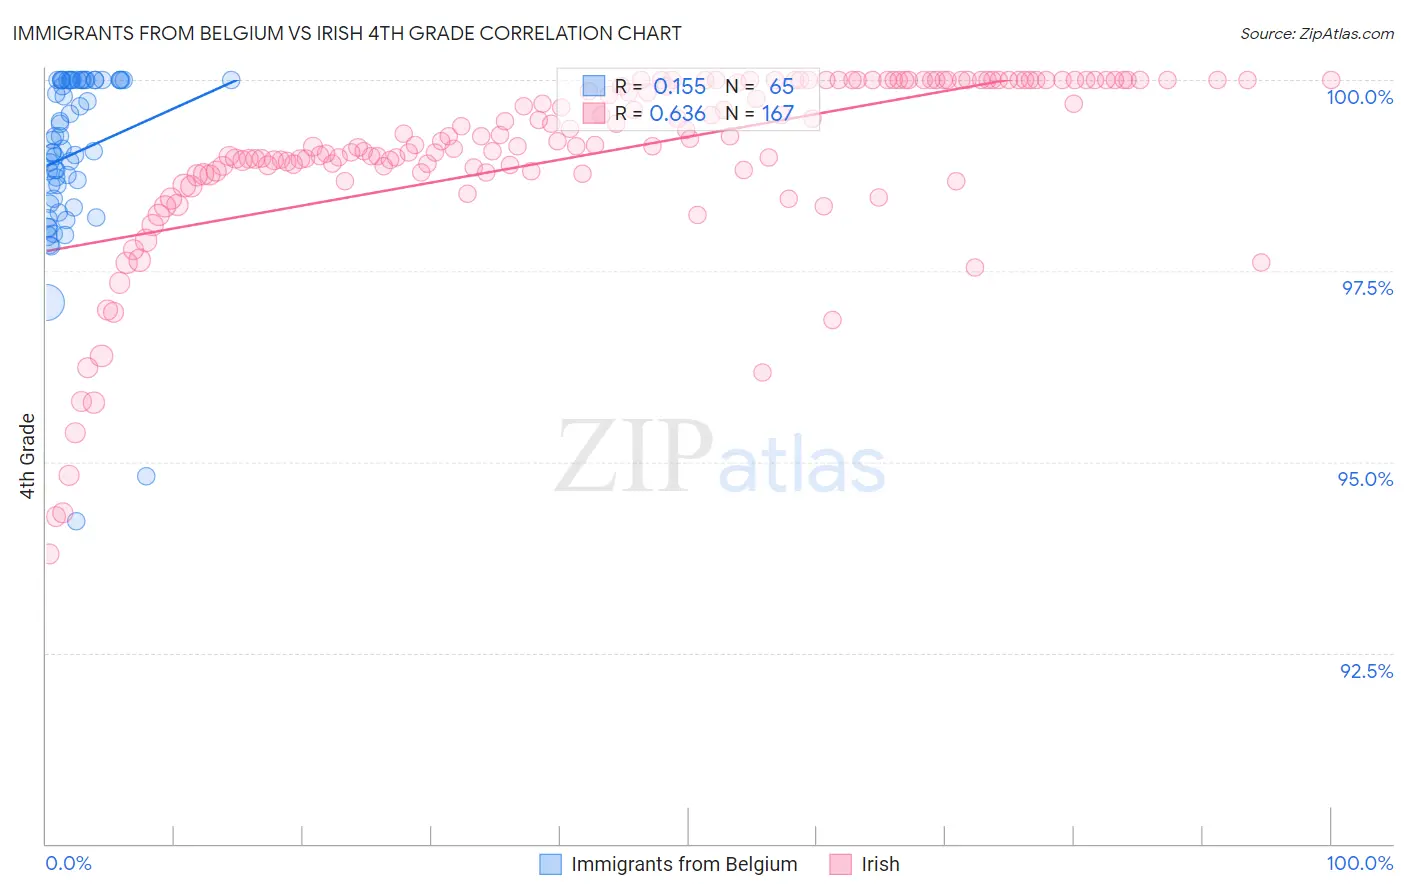
Immigrants from Belgium vs Irish 4th Grade Correlation Chart
The statistical analysis conducted on geographies consisting of 146,727,969 people shows a poor positive correlation between the proportion of Immigrants from Belgium and percentage of population with at least 4th grade education in the United States with a correlation coefficient (R) of 0.155 and weighted average of 97.9%. Similarly, the statistical analysis conducted on geographies consisting of 580,708,089 people shows a significant positive correlation between the proportion of Irish and percentage of population with at least 4th grade education in the United States with a correlation coefficient (R) of 0.636 and weighted average of 98.4%, a difference of 0.43%.
4th Grade Correlation Summary
| Measurement | Immigrants from Belgium | Irish |
| Minimum | 94.2% | 93.8% |
| Maximum | 100.0% | 100.0% |
| Range | 5.8% | 6.2% |
| Mean | 99.0% | 99.0% |
| Median | 99.1% | 99.2% |
| Interquartile 25% (IQ1) | 98.4% | 98.8% |
| Interquartile 75% (IQ3) | 100.0% | 100.0% |
| Interquartile Range (IQR) | 1.6% | 1.2% |
| Standard Deviation (Sample) | 1.1% | 1.2% |
| Standard Deviation (Population) | 1.1% | 1.2% |
Similar Demographics by 4th Grade
Demographics Similar to Immigrants from Belgium by 4th Grade
In terms of 4th grade, the demographic groups most similar to Immigrants from Belgium are Icelander (98.0%, a difference of 0.010%), Cypriot (97.9%, a difference of 0.010%), Potawatomi (97.9%, a difference of 0.010%), Immigrants from Australia (97.9%, a difference of 0.010%), and Ukrainian (98.0%, a difference of 0.020%).
| Demographics | Rating | Rank | 4th Grade |
| Cherokee | 99.3 /100 | #76 | Exceptional 98.0% |
| Immigrants | Lithuania | 99.3 /100 | #77 | Exceptional 98.0% |
| Immigrants | England | 99.3 /100 | #78 | Exceptional 98.0% |
| Ukrainians | 99.2 /100 | #79 | Exceptional 98.0% |
| Osage | 99.2 /100 | #80 | Exceptional 98.0% |
| Immigrants | India | 99.1 /100 | #81 | Exceptional 98.0% |
| Icelanders | 99.1 /100 | #82 | Exceptional 98.0% |
| Immigrants | Belgium | 99.0 /100 | #83 | Exceptional 97.9% |
| Cypriots | 98.9 /100 | #84 | Exceptional 97.9% |
| Potawatomi | 98.9 /100 | #85 | Exceptional 97.9% |
| Immigrants | Australia | 98.8 /100 | #86 | Exceptional 97.9% |
| Zimbabweans | 98.8 /100 | #87 | Exceptional 97.9% |
| Immigrants | South Africa | 98.8 /100 | #88 | Exceptional 97.9% |
| Delaware | 98.8 /100 | #89 | Exceptional 97.9% |
| Immigrants | Denmark | 98.7 /100 | #90 | Exceptional 97.9% |
Demographics Similar to Irish by 4th Grade
In terms of 4th grade, the demographic groups most similar to Irish are Polish (98.4%, a difference of 0.0%), Scottish (98.4%, a difference of 0.010%), Pennsylvania German (98.4%, a difference of 0.010%), Alaska Native (98.4%, a difference of 0.010%), and Lithuanian (98.3%, a difference of 0.010%).
| Demographics | Rating | Rank | 4th Grade |
| Tlingit-Haida | 100.0 /100 | #12 | Exceptional 98.4% |
| Swedes | 100.0 /100 | #13 | Exceptional 98.4% |
| Carpatho Rusyns | 100.0 /100 | #14 | Exceptional 98.4% |
| Dutch | 100.0 /100 | #15 | Exceptional 98.4% |
| Scottish | 100.0 /100 | #16 | Exceptional 98.4% |
| Pennsylvania Germans | 100.0 /100 | #17 | Exceptional 98.4% |
| Poles | 100.0 /100 | #18 | Exceptional 98.4% |
| Irish | 100.0 /100 | #19 | Exceptional 98.4% |
| Alaska Natives | 100.0 /100 | #20 | Exceptional 98.4% |
| Lithuanians | 100.0 /100 | #21 | Exceptional 98.3% |
| Finns | 100.0 /100 | #22 | Exceptional 98.3% |
| Sioux | 100.0 /100 | #23 | Exceptional 98.3% |
| Danes | 100.0 /100 | #24 | Exceptional 98.3% |
| Scotch-Irish | 100.0 /100 | #25 | Exceptional 98.3% |
| Croatians | 100.0 /100 | #26 | Exceptional 98.3% |