Immigrants from Belarus vs Immigrants from Ukraine 1st Grade
COMPARE
Immigrants from Belarus
Immigrants from Ukraine
1st Grade
1st Grade Comparison
Immigrants from Belarus
Immigrants from Ukraine
97.9%
1ST GRADE
39.3/ 100
METRIC RATING
185th/ 347
METRIC RANK
97.8%
1ST GRADE
19.2/ 100
METRIC RATING
202nd/ 347
METRIC RANK
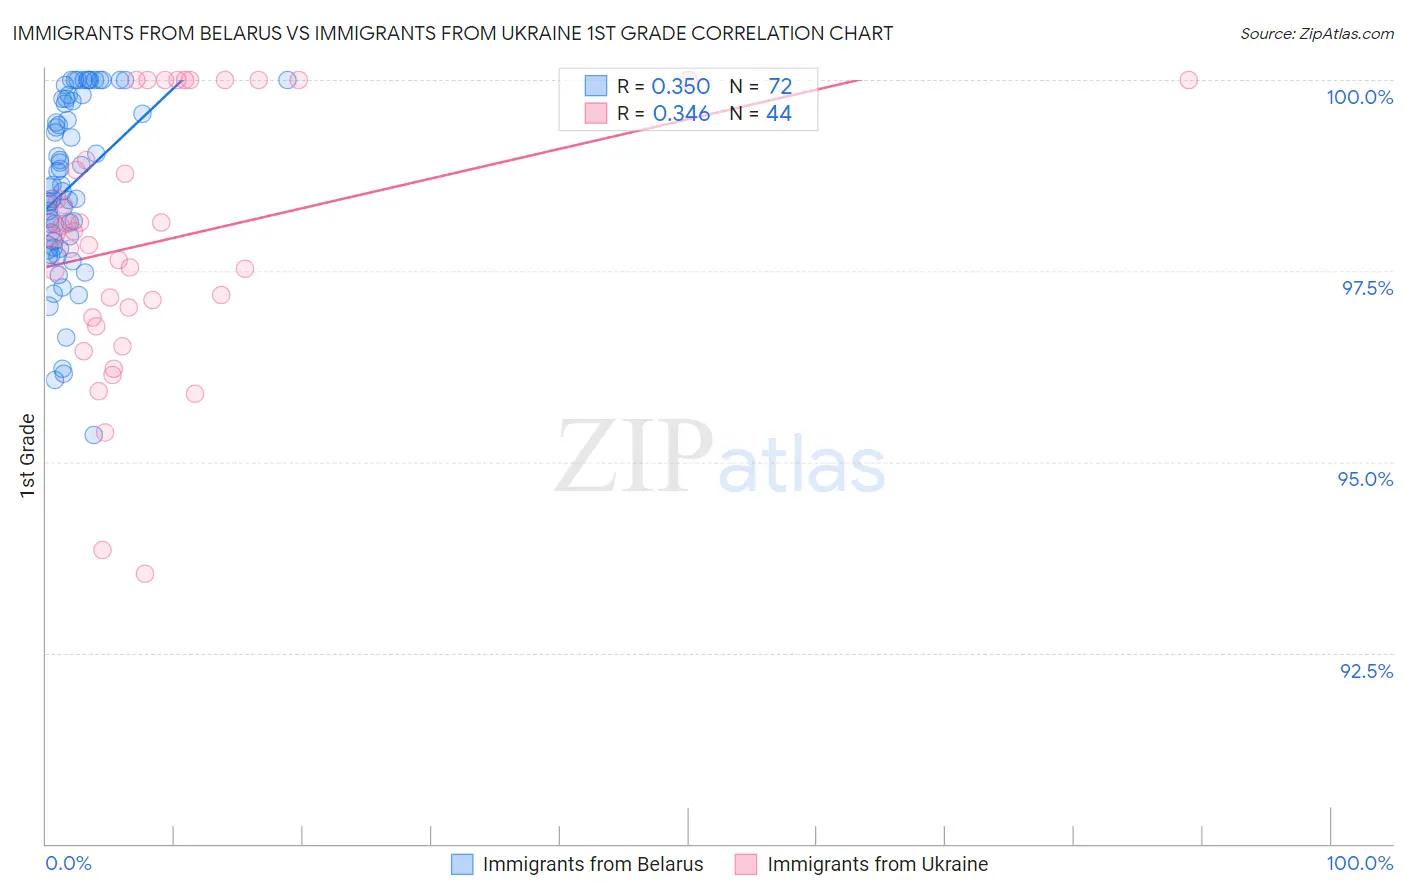
Immigrants from Belarus vs Immigrants from Ukraine 1st Grade Correlation Chart
The statistical analysis conducted on geographies consisting of 149,993,317 people shows a mild positive correlation between the proportion of Immigrants from Belarus and percentage of population with at least 1st grade education in the United States with a correlation coefficient (R) of 0.350 and weighted average of 97.9%. Similarly, the statistical analysis conducted on geographies consisting of 289,712,791 people shows a mild positive correlation between the proportion of Immigrants from Ukraine and percentage of population with at least 1st grade education in the United States with a correlation coefficient (R) of 0.346 and weighted average of 97.8%, a difference of 0.080%.
1st Grade Correlation Summary
| Measurement | Immigrants from Belarus | Immigrants from Ukraine |
| Minimum | 95.4% | 93.5% |
| Maximum | 100.0% | 100.0% |
| Range | 4.6% | 6.5% |
| Mean | 98.6% | 97.9% |
| Median | 98.6% | 98.0% |
| Interquartile 25% (IQ1) | 97.8% | 97.0% |
| Interquartile 75% (IQ3) | 99.7% | 99.5% |
| Interquartile Range (IQR) | 1.9% | 2.5% |
| Standard Deviation (Sample) | 1.1% | 1.6% |
| Standard Deviation (Population) | 1.1% | 1.6% |
Demographics Similar to Immigrants from Belarus and Immigrants from Ukraine by 1st Grade
In terms of 1st grade, the demographic groups most similar to Immigrants from Belarus are Immigrants from Poland (97.9%, a difference of 0.0%), Immigrants from Argentina (97.9%, a difference of 0.010%), Paiute (97.9%, a difference of 0.010%), Pakistani (97.9%, a difference of 0.010%), and Arab (97.9%, a difference of 0.010%). Similarly, the demographic groups most similar to Immigrants from Ukraine are Immigrants from Lebanon (97.8%, a difference of 0.0%), Immigrants from Southern Europe (97.8%, a difference of 0.0%), Yuman (97.8%, a difference of 0.020%), Tohono O'odham (97.8%, a difference of 0.020%), and Immigrants from Egypt (97.8%, a difference of 0.020%).
| Demographics | Rating | Rank | 1st Grade |
| Immigrants | Argentina | 41.3 /100 | #183 | Average 97.9% |
| Immigrants | Poland | 40.1 /100 | #184 | Average 97.9% |
| Immigrants | Belarus | 39.3 /100 | #185 | Fair 97.9% |
| Paiute | 36.5 /100 | #186 | Fair 97.9% |
| Pakistanis | 35.8 /100 | #187 | Fair 97.9% |
| Arabs | 35.5 /100 | #188 | Fair 97.9% |
| Immigrants | Kazakhstan | 34.9 /100 | #189 | Fair 97.9% |
| Panamanians | 34.1 /100 | #190 | Fair 97.9% |
| Blacks/African Americans | 30.7 /100 | #191 | Fair 97.9% |
| Paraguayans | 30.2 /100 | #192 | Fair 97.9% |
| Immigrants | Taiwan | 29.4 /100 | #193 | Fair 97.9% |
| Mongolians | 29.2 /100 | #194 | Fair 97.9% |
| Hawaiians | 28.8 /100 | #195 | Fair 97.9% |
| Immigrants | Kenya | 26.3 /100 | #196 | Fair 97.8% |
| Guamanians/Chamorros | 26.2 /100 | #197 | Fair 97.8% |
| Yuman | 24.4 /100 | #198 | Fair 97.8% |
| Tohono O'odham | 23.2 /100 | #199 | Fair 97.8% |
| Immigrants | Egypt | 22.6 /100 | #200 | Fair 97.8% |
| Immigrants | Lebanon | 20.1 /100 | #201 | Fair 97.8% |
| Immigrants | Ukraine | 19.2 /100 | #202 | Poor 97.8% |
| Immigrants | Southern Europe | 18.2 /100 | #203 | Poor 97.8% |