Immigrants from Barbados vs Taiwanese 12th Grade, No Diploma
COMPARE
Immigrants from Barbados
Taiwanese
12th Grade, No Diploma
12th Grade, No Diploma Comparison
Immigrants from Barbados
Taiwanese
89.0%
12TH GRADE, NO DIPLOMA
0.0/ 100
METRIC RATING
277th/ 347
METRIC RANK
90.0%
12TH GRADE, NO DIPLOMA
1.5/ 100
METRIC RATING
244th/ 347
METRIC RANK
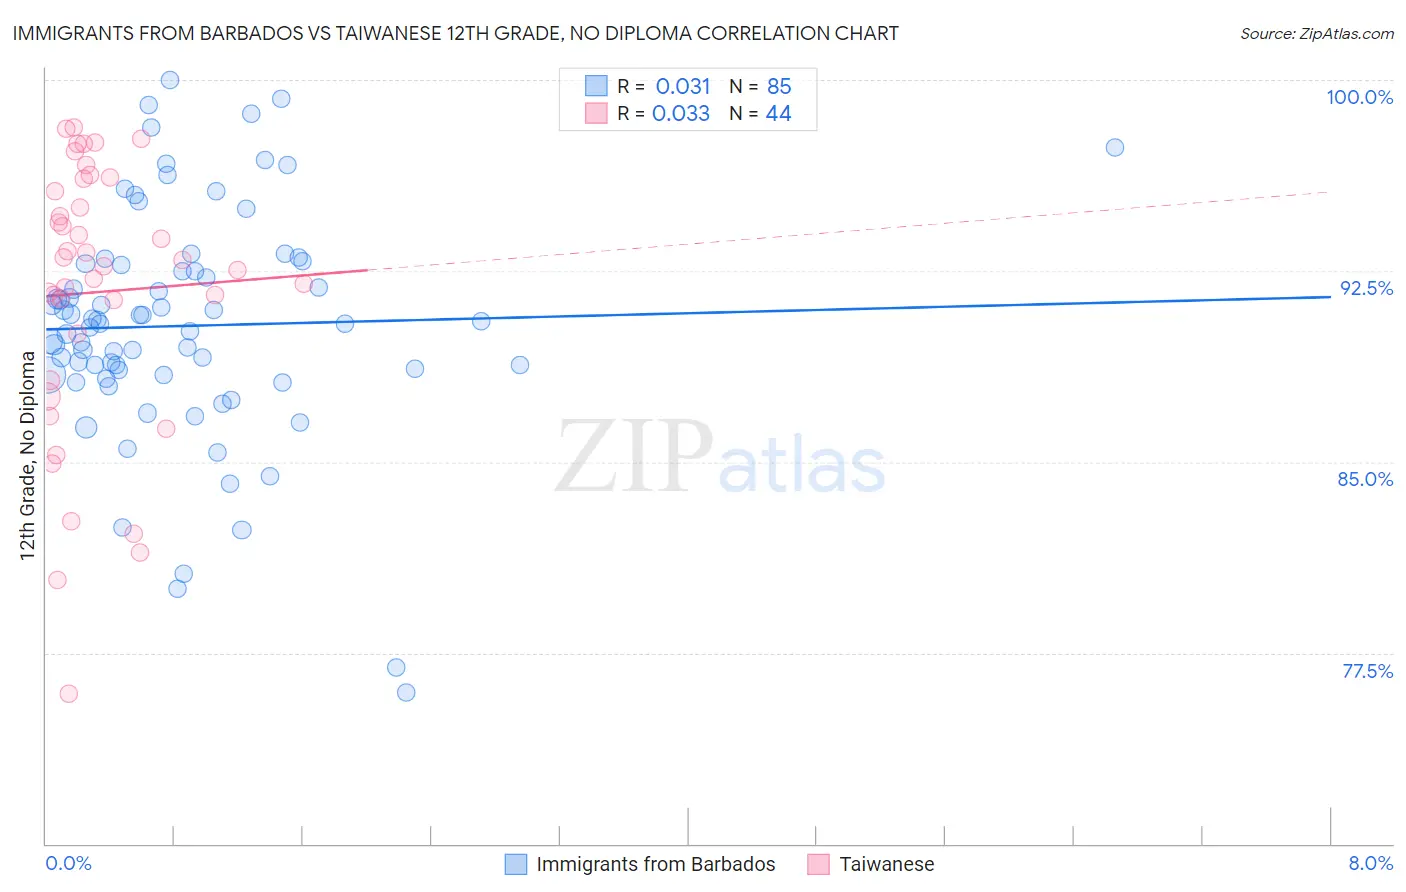
Immigrants from Barbados vs Taiwanese 12th Grade, No Diploma Correlation Chart
The statistical analysis conducted on geographies consisting of 112,782,130 people shows no correlation between the proportion of Immigrants from Barbados and percentage of population with at least 12th grade (no diploma) education in the United States with a correlation coefficient (R) of 0.031 and weighted average of 89.0%. Similarly, the statistical analysis conducted on geographies consisting of 31,724,936 people shows no correlation between the proportion of Taiwanese and percentage of population with at least 12th grade (no diploma) education in the United States with a correlation coefficient (R) of 0.033 and weighted average of 90.0%, a difference of 1.1%.
12th Grade, No Diploma Correlation Summary
| Measurement | Immigrants from Barbados | Taiwanese |
| Minimum | 76.0% | 75.9% |
| Maximum | 100.0% | 98.1% |
| Range | 24.0% | 22.2% |
| Mean | 90.3% | 91.7% |
| Median | 90.4% | 92.8% |
| Interquartile 25% (IQ1) | 88.4% | 89.1% |
| Interquartile 75% (IQ3) | 92.8% | 95.9% |
| Interquartile Range (IQR) | 4.4% | 6.8% |
| Standard Deviation (Sample) | 4.6% | 5.4% |
| Standard Deviation (Population) | 4.5% | 5.3% |
Similar Demographics by 12th Grade, No Diploma
Demographics Similar to Immigrants from Barbados by 12th Grade, No Diploma
In terms of 12th grade, no diploma, the demographic groups most similar to Immigrants from Barbados are Ute (89.0%, a difference of 0.050%), Immigrants from Congo (89.0%, a difference of 0.060%), Immigrants from St. Vincent and the Grenadines (88.9%, a difference of 0.060%), Cajun (89.1%, a difference of 0.13%), and Immigrants from Laos (88.9%, a difference of 0.13%).
| Demographics | Rating | Rank | 12th Grade, No Diploma |
| Bangladeshis | 0.1 /100 | #270 | Tragic 89.3% |
| Blacks/African Americans | 0.1 /100 | #271 | Tragic 89.3% |
| Malaysians | 0.1 /100 | #272 | Tragic 89.2% |
| Barbadians | 0.1 /100 | #273 | Tragic 89.1% |
| Cajuns | 0.1 /100 | #274 | Tragic 89.1% |
| Immigrants | Congo | 0.1 /100 | #275 | Tragic 89.0% |
| Ute | 0.1 /100 | #276 | Tragic 89.0% |
| Immigrants | Barbados | 0.0 /100 | #277 | Tragic 89.0% |
| Immigrants | St. Vincent and the Grenadines | 0.0 /100 | #278 | Tragic 88.9% |
| Immigrants | Laos | 0.0 /100 | #279 | Tragic 88.9% |
| Immigrants | Burma/Myanmar | 0.0 /100 | #280 | Tragic 88.9% |
| Cubans | 0.0 /100 | #281 | Tragic 88.9% |
| Immigrants | Vietnam | 0.0 /100 | #282 | Tragic 88.7% |
| Paiute | 0.0 /100 | #283 | Tragic 88.7% |
| Pennsylvania Germans | 0.0 /100 | #284 | Tragic 88.7% |
Demographics Similar to Taiwanese by 12th Grade, No Diploma
In terms of 12th grade, no diploma, the demographic groups most similar to Taiwanese are Crow (90.0%, a difference of 0.0%), Immigrants from Costa Rica (90.0%, a difference of 0.010%), Kiowa (90.0%, a difference of 0.040%), Immigrants from Middle Africa (90.0%, a difference of 0.040%), and Immigrants from Uruguay (90.0%, a difference of 0.040%).
| Demographics | Rating | Rank | 12th Grade, No Diploma |
| Immigrants | Colombia | 2.1 /100 | #237 | Tragic 90.1% |
| Inupiat | 2.0 /100 | #238 | Tragic 90.1% |
| Sub-Saharan Africans | 1.9 /100 | #239 | Tragic 90.1% |
| Kiowa | 1.7 /100 | #240 | Tragic 90.0% |
| Immigrants | Middle Africa | 1.7 /100 | #241 | Tragic 90.0% |
| Immigrants | Costa Rica | 1.6 /100 | #242 | Tragic 90.0% |
| Crow | 1.5 /100 | #243 | Tragic 90.0% |
| Taiwanese | 1.5 /100 | #244 | Tragic 90.0% |
| Immigrants | Uruguay | 1.4 /100 | #245 | Tragic 90.0% |
| Ghanaians | 1.3 /100 | #246 | Tragic 90.0% |
| Immigrants | Nigeria | 1.3 /100 | #247 | Tragic 89.9% |
| Comanche | 1.1 /100 | #248 | Tragic 89.9% |
| Senegalese | 1.1 /100 | #249 | Tragic 89.9% |
| Immigrants | Eritrea | 1.0 /100 | #250 | Tragic 89.9% |
| Spanish Americans | 0.9 /100 | #251 | Tragic 89.9% |