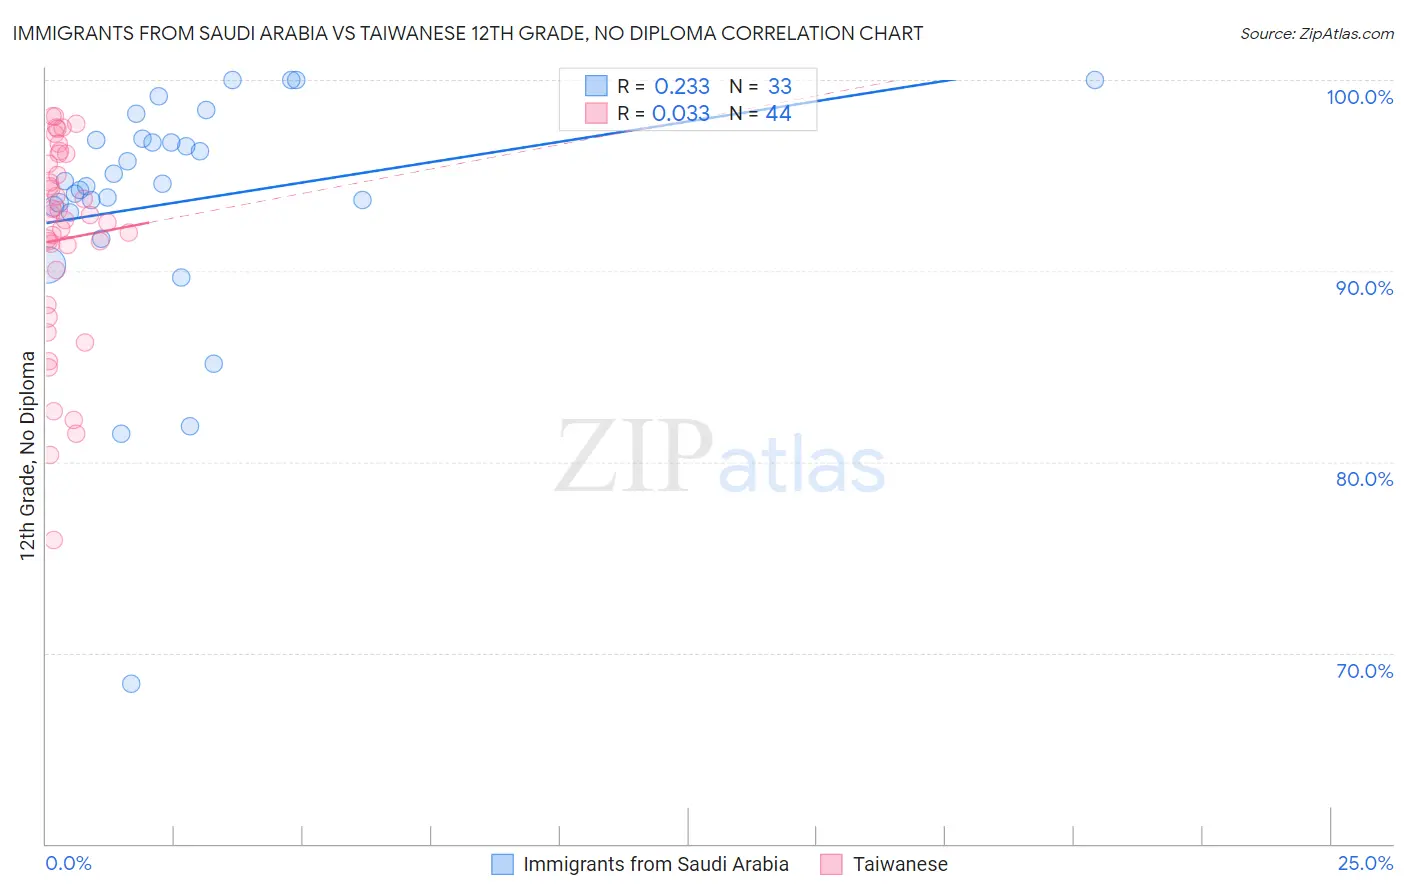
Immigrants from Saudi Arabia vs Taiwanese 12th Grade, No Diploma
COMPARE
Immigrants from Saudi Arabia
Taiwanese
12th Grade, No Diploma
12th Grade, No Diploma Comparison
Immigrants from Saudi Arabia
Taiwanese
92.5%
12TH GRADE, NO DIPLOMA
99.0/ 100
METRIC RATING
85th/ 347
METRIC RANK
90.0%
12TH GRADE, NO DIPLOMA
1.5/ 100
METRIC RATING
244th/ 347
METRIC RANK
Immigrants from Saudi Arabia vs Taiwanese 12th Grade, No Diploma Correlation Chart
The statistical analysis conducted on geographies consisting of 164,289,382 people shows a weak positive correlation between the proportion of Immigrants from Saudi Arabia and percentage of population with at least 12th grade (no diploma) education in the United States with a correlation coefficient (R) of 0.233 and weighted average of 92.5%. Similarly, the statistical analysis conducted on geographies consisting of 31,724,936 people shows no correlation between the proportion of Taiwanese and percentage of population with at least 12th grade (no diploma) education in the United States with a correlation coefficient (R) of 0.033 and weighted average of 90.0%, a difference of 2.7%.
12th Grade, No Diploma Correlation Summary
| Measurement | Immigrants from Saudi Arabia | Taiwanese |
| Minimum | 68.4% | 75.9% |
| Maximum | 100.0% | 98.1% |
| Range | 31.6% | 22.2% |
| Mean | 93.6% | 91.7% |
| Median | 94.5% | 92.8% |
| Interquartile 25% (IQ1) | 93.2% | 89.1% |
| Interquartile 75% (IQ3) | 96.9% | 95.9% |
| Interquartile Range (IQR) | 3.7% | 6.8% |
| Standard Deviation (Sample) | 6.4% | 5.4% |
| Standard Deviation (Population) | 6.3% | 5.3% |
Similar Demographics by 12th Grade, No Diploma
Demographics Similar to Immigrants from Saudi Arabia by 12th Grade, No Diploma
In terms of 12th grade, no diploma, the demographic groups most similar to Immigrants from Saudi Arabia are Immigrants from Bulgaria (92.5%, a difference of 0.020%), Immigrants from Turkey (92.4%, a difference of 0.050%), Immigrants from Israel (92.5%, a difference of 0.060%), Immigrants from Switzerland (92.5%, a difference of 0.070%), and Immigrants from France (92.4%, a difference of 0.070%).
| Demographics | Rating | Rank | 12th Grade, No Diploma |
| Cambodians | 99.3 /100 | #78 | Exceptional 92.6% |
| Romanians | 99.3 /100 | #79 | Exceptional 92.6% |
| French Canadians | 99.3 /100 | #80 | Exceptional 92.6% |
| Immigrants | Denmark | 99.2 /100 | #81 | Exceptional 92.5% |
| Immigrants | Switzerland | 99.2 /100 | #82 | Exceptional 92.5% |
| Immigrants | Israel | 99.2 /100 | #83 | Exceptional 92.5% |
| Immigrants | Bulgaria | 99.1 /100 | #84 | Exceptional 92.5% |
| Immigrants | Saudi Arabia | 99.0 /100 | #85 | Exceptional 92.5% |
| Immigrants | Turkey | 98.9 /100 | #86 | Exceptional 92.4% |
| Immigrants | France | 98.8 /100 | #87 | Exceptional 92.4% |
| Scotch-Irish | 98.8 /100 | #88 | Exceptional 92.4% |
| Canadians | 98.7 /100 | #89 | Exceptional 92.4% |
| Immigrants | Serbia | 98.6 /100 | #90 | Exceptional 92.4% |
| South Africans | 98.6 /100 | #91 | Exceptional 92.4% |
| Immigrants | Romania | 98.5 /100 | #92 | Exceptional 92.3% |
Demographics Similar to Taiwanese by 12th Grade, No Diploma
In terms of 12th grade, no diploma, the demographic groups most similar to Taiwanese are Crow (90.0%, a difference of 0.0%), Immigrants from Costa Rica (90.0%, a difference of 0.010%), Kiowa (90.0%, a difference of 0.040%), Immigrants from Middle Africa (90.0%, a difference of 0.040%), and Immigrants from Uruguay (90.0%, a difference of 0.040%).
| Demographics | Rating | Rank | 12th Grade, No Diploma |
| Immigrants | Colombia | 2.1 /100 | #237 | Tragic 90.1% |
| Inupiat | 2.0 /100 | #238 | Tragic 90.1% |
| Sub-Saharan Africans | 1.9 /100 | #239 | Tragic 90.1% |
| Kiowa | 1.7 /100 | #240 | Tragic 90.0% |
| Immigrants | Middle Africa | 1.7 /100 | #241 | Tragic 90.0% |
| Immigrants | Costa Rica | 1.6 /100 | #242 | Tragic 90.0% |
| Crow | 1.5 /100 | #243 | Tragic 90.0% |
| Taiwanese | 1.5 /100 | #244 | Tragic 90.0% |
| Immigrants | Uruguay | 1.4 /100 | #245 | Tragic 90.0% |
| Ghanaians | 1.3 /100 | #246 | Tragic 90.0% |
| Immigrants | Nigeria | 1.3 /100 | #247 | Tragic 89.9% |
| Comanche | 1.1 /100 | #248 | Tragic 89.9% |
| Senegalese | 1.1 /100 | #249 | Tragic 89.9% |
| Immigrants | Eritrea | 1.0 /100 | #250 | Tragic 89.9% |
| Spanish Americans | 0.9 /100 | #251 | Tragic 89.9% |