Immigrants from Barbados vs Burmese 12th Grade, No Diploma
COMPARE
Immigrants from Barbados
Burmese
12th Grade, No Diploma
12th Grade, No Diploma Comparison
Immigrants from Barbados
Burmese
89.0%
12TH GRADE, NO DIPLOMA
0.0/ 100
METRIC RATING
277th/ 347
METRIC RANK
92.6%
12TH GRADE, NO DIPLOMA
99.4/ 100
METRIC RATING
73rd/ 347
METRIC RANK
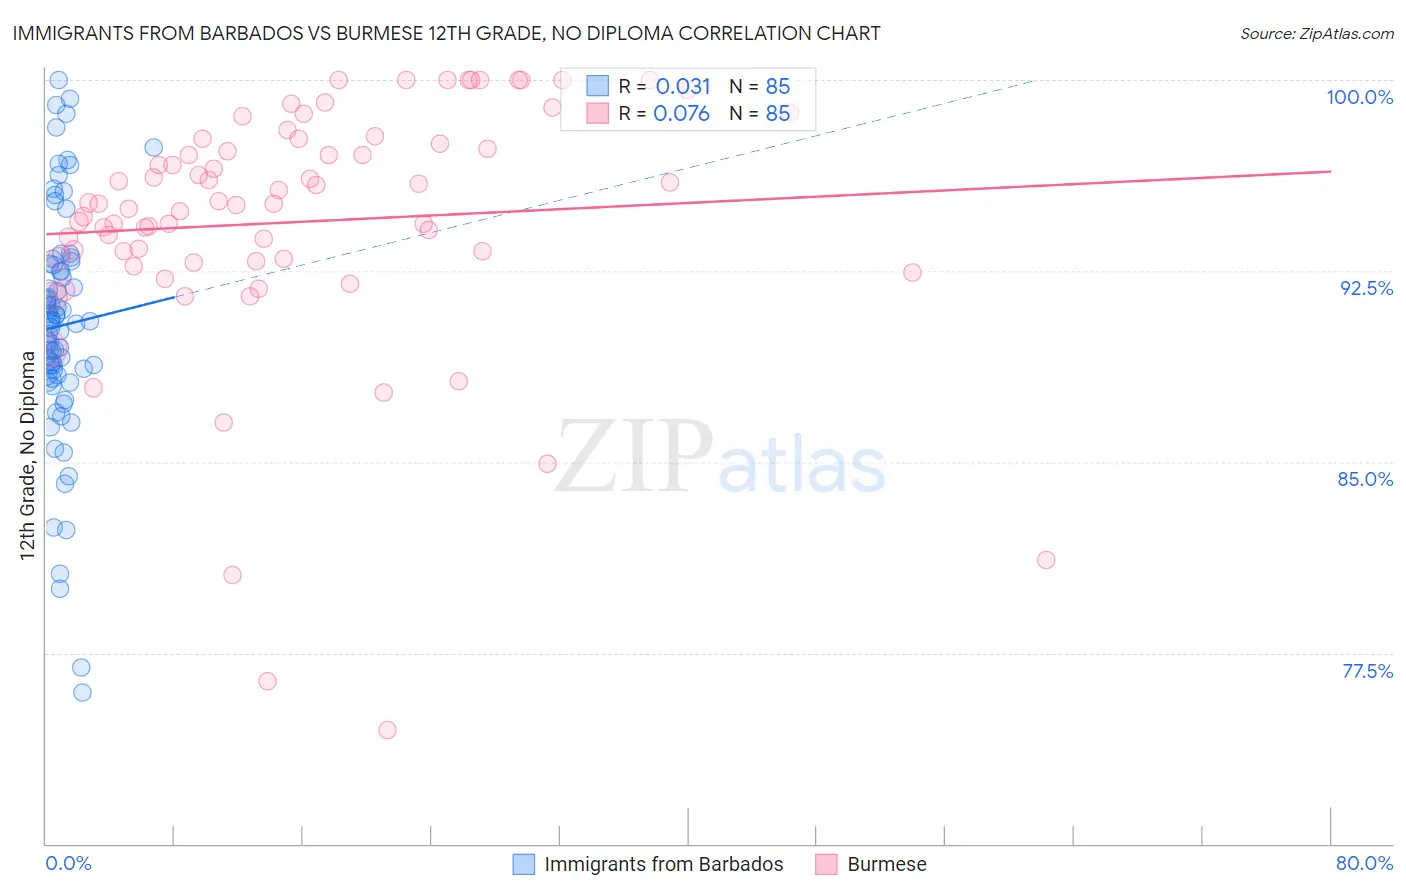
Immigrants from Barbados vs Burmese 12th Grade, No Diploma Correlation Chart
The statistical analysis conducted on geographies consisting of 112,782,130 people shows no correlation between the proportion of Immigrants from Barbados and percentage of population with at least 12th grade (no diploma) education in the United States with a correlation coefficient (R) of 0.031 and weighted average of 89.0%. Similarly, the statistical analysis conducted on geographies consisting of 465,370,486 people shows a slight positive correlation between the proportion of Burmese and percentage of population with at least 12th grade (no diploma) education in the United States with a correlation coefficient (R) of 0.076 and weighted average of 92.6%, a difference of 4.1%.
12th Grade, No Diploma Correlation Summary
| Measurement | Immigrants from Barbados | Burmese |
| Minimum | 76.0% | 74.5% |
| Maximum | 100.0% | 100.0% |
| Range | 24.0% | 25.5% |
| Mean | 90.3% | 94.4% |
| Median | 90.4% | 95.1% |
| Interquartile 25% (IQ1) | 88.4% | 92.9% |
| Interquartile 75% (IQ3) | 92.8% | 97.6% |
| Interquartile Range (IQR) | 4.4% | 4.7% |
| Standard Deviation (Sample) | 4.6% | 4.9% |
| Standard Deviation (Population) | 4.5% | 4.9% |
Similar Demographics by 12th Grade, No Diploma
Demographics Similar to Immigrants from Barbados by 12th Grade, No Diploma
In terms of 12th grade, no diploma, the demographic groups most similar to Immigrants from Barbados are Ute (89.0%, a difference of 0.050%), Immigrants from Congo (89.0%, a difference of 0.060%), Immigrants from St. Vincent and the Grenadines (88.9%, a difference of 0.060%), Cajun (89.1%, a difference of 0.13%), and Immigrants from Laos (88.9%, a difference of 0.13%).
| Demographics | Rating | Rank | 12th Grade, No Diploma |
| Bangladeshis | 0.1 /100 | #270 | Tragic 89.3% |
| Blacks/African Americans | 0.1 /100 | #271 | Tragic 89.3% |
| Malaysians | 0.1 /100 | #272 | Tragic 89.2% |
| Barbadians | 0.1 /100 | #273 | Tragic 89.1% |
| Cajuns | 0.1 /100 | #274 | Tragic 89.1% |
| Immigrants | Congo | 0.1 /100 | #275 | Tragic 89.0% |
| Ute | 0.1 /100 | #276 | Tragic 89.0% |
| Immigrants | Barbados | 0.0 /100 | #277 | Tragic 89.0% |
| Immigrants | St. Vincent and the Grenadines | 0.0 /100 | #278 | Tragic 88.9% |
| Immigrants | Laos | 0.0 /100 | #279 | Tragic 88.9% |
| Immigrants | Burma/Myanmar | 0.0 /100 | #280 | Tragic 88.9% |
| Cubans | 0.0 /100 | #281 | Tragic 88.9% |
| Immigrants | Vietnam | 0.0 /100 | #282 | Tragic 88.7% |
| Paiute | 0.0 /100 | #283 | Tragic 88.7% |
| Pennsylvania Germans | 0.0 /100 | #284 | Tragic 88.7% |
Demographics Similar to Burmese by 12th Grade, No Diploma
In terms of 12th grade, no diploma, the demographic groups most similar to Burmese are Immigrants from Moldova (92.6%, a difference of 0.0%), Native Hawaiian (92.6%, a difference of 0.0%), Immigrants from South Central Asia (92.6%, a difference of 0.010%), French (92.6%, a difference of 0.010%), and Immigrants from England (92.6%, a difference of 0.020%).
| Demographics | Rating | Rank | 12th Grade, No Diploma |
| Soviet Union | 99.6 /100 | #66 | Exceptional 92.7% |
| Immigrants | South Africa | 99.5 /100 | #67 | Exceptional 92.7% |
| Immigrants | Czechoslovakia | 99.5 /100 | #68 | Exceptional 92.7% |
| Immigrants | Iran | 99.5 /100 | #69 | Exceptional 92.7% |
| Czechoslovakians | 99.5 /100 | #70 | Exceptional 92.6% |
| Immigrants | Latvia | 99.5 /100 | #71 | Exceptional 92.6% |
| Immigrants | South Central Asia | 99.5 /100 | #72 | Exceptional 92.6% |
| Burmese | 99.4 /100 | #73 | Exceptional 92.6% |
| Immigrants | Moldova | 99.4 /100 | #74 | Exceptional 92.6% |
| Native Hawaiians | 99.4 /100 | #75 | Exceptional 92.6% |
| French | 99.4 /100 | #76 | Exceptional 92.6% |
| Immigrants | England | 99.4 /100 | #77 | Exceptional 92.6% |
| Cambodians | 99.3 /100 | #78 | Exceptional 92.6% |
| Romanians | 99.3 /100 | #79 | Exceptional 92.6% |
| French Canadians | 99.3 /100 | #80 | Exceptional 92.6% |