Immigrants from Barbados vs Pennsylvania German Professional Degree
COMPARE
Immigrants from Barbados
Pennsylvania German
Professional Degree
Professional Degree Comparison
Immigrants from Barbados
Pennsylvania Germans
3.9%
PROFESSIONAL DEGREE
4.0/ 100
METRIC RATING
235th/ 347
METRIC RANK
3.0%
PROFESSIONAL DEGREE
0.0/ 100
METRIC RATING
334th/ 347
METRIC RANK
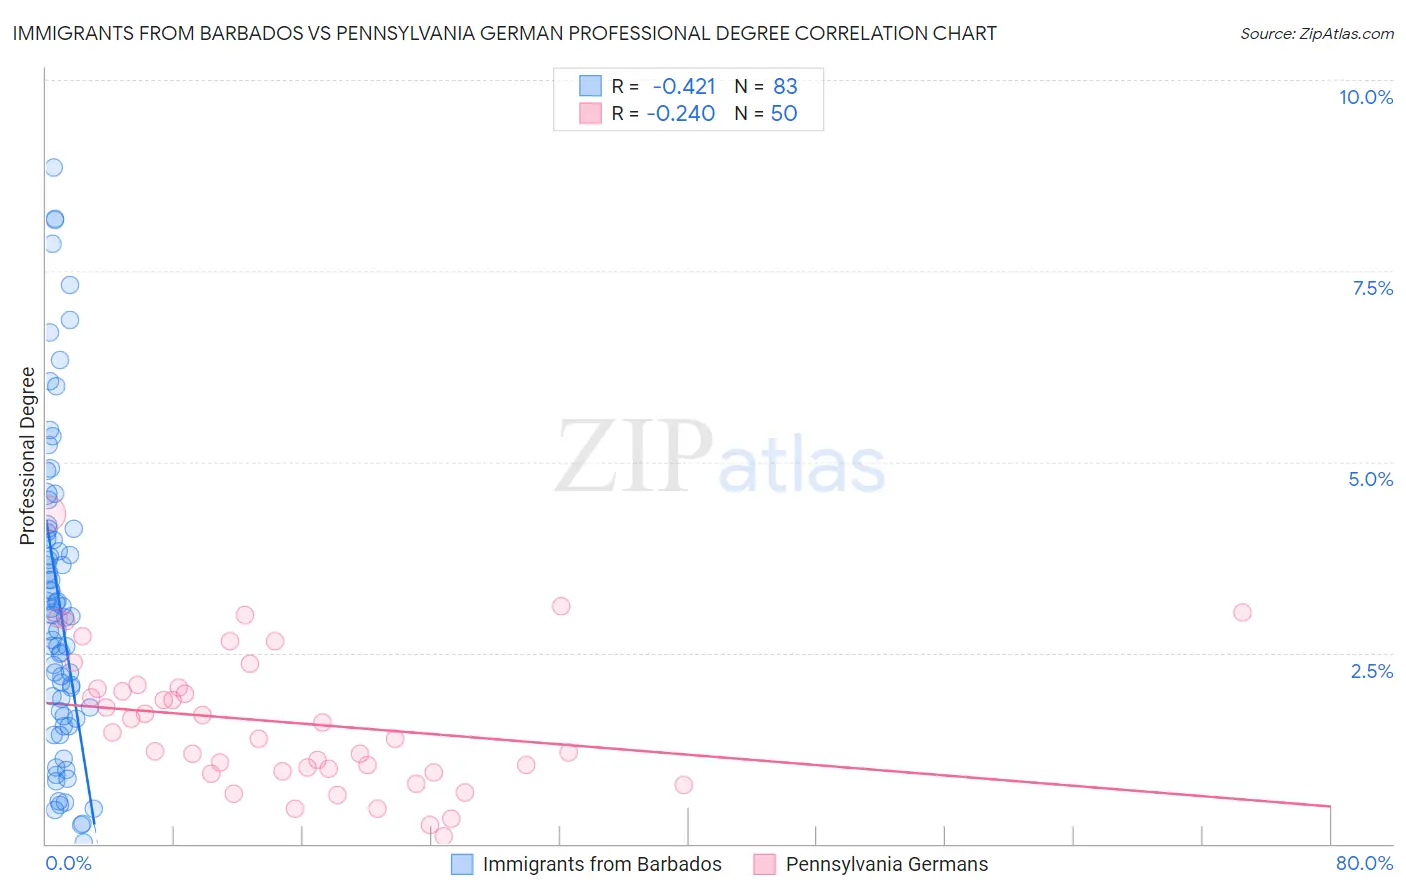
Immigrants from Barbados vs Pennsylvania German Professional Degree Correlation Chart
The statistical analysis conducted on geographies consisting of 112,711,705 people shows a moderate negative correlation between the proportion of Immigrants from Barbados and percentage of population with at least professional degree education in the United States with a correlation coefficient (R) of -0.421 and weighted average of 3.9%. Similarly, the statistical analysis conducted on geographies consisting of 233,026,471 people shows a weak negative correlation between the proportion of Pennsylvania Germans and percentage of population with at least professional degree education in the United States with a correlation coefficient (R) of -0.240 and weighted average of 3.0%, a difference of 31.2%.
Professional Degree Correlation Summary
| Measurement | Immigrants from Barbados | Pennsylvania German |
| Minimum | 0.017% | 0.10% |
| Maximum | 8.9% | 4.3% |
| Range | 8.8% | 4.2% |
| Mean | 3.2% | 1.6% |
| Median | 3.0% | 1.4% |
| Interquartile 25% (IQ1) | 1.7% | 0.94% |
| Interquartile 75% (IQ3) | 4.1% | 2.0% |
| Interquartile Range (IQR) | 2.4% | 1.1% |
| Standard Deviation (Sample) | 2.0% | 0.90% |
| Standard Deviation (Population) | 2.0% | 0.89% |
Similar Demographics by Professional Degree
Demographics Similar to Immigrants from Barbados by Professional Degree
In terms of professional degree, the demographic groups most similar to Immigrants from Barbados are Nonimmigrants (3.9%, a difference of 0.010%), Immigrants from Philippines (3.9%, a difference of 0.050%), Spanish American (3.9%, a difference of 0.22%), Immigrants from Trinidad and Tobago (3.9%, a difference of 0.29%), and Cree (3.9%, a difference of 0.31%).
| Demographics | Rating | Rank | Professional Degree |
| Immigrants | West Indies | 5.6 /100 | #228 | Tragic 4.0% |
| Immigrants | Burma/Myanmar | 5.4 /100 | #229 | Tragic 3.9% |
| Nicaraguans | 5.1 /100 | #230 | Tragic 3.9% |
| Ecuadorians | 4.6 /100 | #231 | Tragic 3.9% |
| Cree | 4.3 /100 | #232 | Tragic 3.9% |
| Immigrants | Philippines | 4.1 /100 | #233 | Tragic 3.9% |
| Immigrants | Nonimmigrants | 4.0 /100 | #234 | Tragic 3.9% |
| Immigrants | Barbados | 4.0 /100 | #235 | Tragic 3.9% |
| Spanish Americans | 3.8 /100 | #236 | Tragic 3.9% |
| Immigrants | Trinidad and Tobago | 3.8 /100 | #237 | Tragic 3.9% |
| Colville | 2.6 /100 | #238 | Tragic 3.8% |
| British West Indians | 2.4 /100 | #239 | Tragic 3.8% |
| Immigrants | Ecuador | 2.3 /100 | #240 | Tragic 3.8% |
| Alaskan Athabascans | 2.3 /100 | #241 | Tragic 3.8% |
| Native Hawaiians | 2.3 /100 | #242 | Tragic 3.8% |
Demographics Similar to Pennsylvania Germans by Professional Degree
In terms of professional degree, the demographic groups most similar to Pennsylvania Germans are Native/Alaskan (3.0%, a difference of 0.56%), Fijian (2.9%, a difference of 1.6%), Arapaho (2.9%, a difference of 3.4%), Navajo (2.9%, a difference of 3.5%), and Immigrants from Central America (2.9%, a difference of 3.6%).
| Demographics | Rating | Rank | Professional Degree |
| Dutch West Indians | 0.0 /100 | #327 | Tragic 3.1% |
| Creek | 0.0 /100 | #328 | Tragic 3.1% |
| Bangladeshis | 0.0 /100 | #329 | Tragic 3.1% |
| Immigrants | Cabo Verde | 0.0 /100 | #330 | Tragic 3.1% |
| Kiowa | 0.0 /100 | #331 | Tragic 3.1% |
| Yakama | 0.0 /100 | #332 | Tragic 3.1% |
| Puget Sound Salish | 0.0 /100 | #333 | Tragic 3.1% |
| Pennsylvania Germans | 0.0 /100 | #334 | Tragic 3.0% |
| Natives/Alaskans | 0.0 /100 | #335 | Tragic 3.0% |
| Fijians | 0.0 /100 | #336 | Tragic 2.9% |
| Arapaho | 0.0 /100 | #337 | Tragic 2.9% |
| Navajo | 0.0 /100 | #338 | Tragic 2.9% |
| Immigrants | Central America | 0.0 /100 | #339 | Tragic 2.9% |
| Yup'ik | 0.0 /100 | #340 | Tragic 2.9% |
| Tohono O'odham | 0.0 /100 | #341 | Tragic 2.8% |