Immigrants from Bangladesh vs Chilean 2nd Grade
COMPARE
Immigrants from Bangladesh
Chilean
2nd Grade
2nd Grade Comparison
Immigrants from Bangladesh
Chileans
96.7%
2ND GRADE
0.0/ 100
METRIC RATING
322nd/ 347
METRIC RANK
97.9%
2ND GRADE
56.1/ 100
METRIC RATING
167th/ 347
METRIC RANK
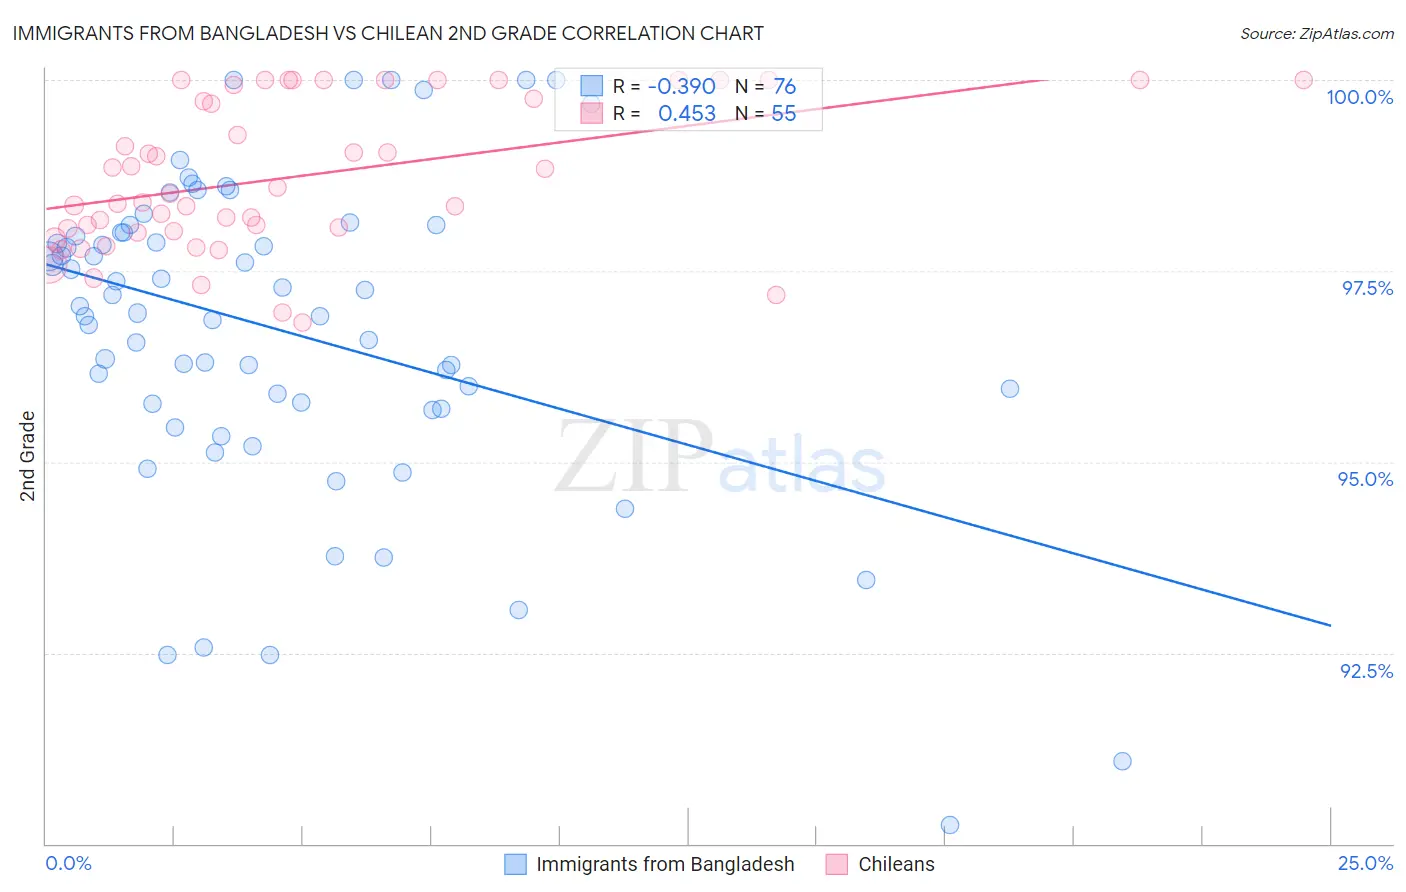
Immigrants from Bangladesh vs Chilean 2nd Grade Correlation Chart
The statistical analysis conducted on geographies consisting of 203,681,254 people shows a mild negative correlation between the proportion of Immigrants from Bangladesh and percentage of population with at least 2nd grade education in the United States with a correlation coefficient (R) of -0.390 and weighted average of 96.7%. Similarly, the statistical analysis conducted on geographies consisting of 256,684,337 people shows a moderate positive correlation between the proportion of Chileans and percentage of population with at least 2nd grade education in the United States with a correlation coefficient (R) of 0.453 and weighted average of 97.9%, a difference of 1.2%.
2nd Grade Correlation Summary
| Measurement | Immigrants from Bangladesh | Chilean |
| Minimum | 90.2% | 96.8% |
| Maximum | 100.0% | 100.0% |
| Range | 9.8% | 3.2% |
| Mean | 96.7% | 98.7% |
| Median | 97.0% | 98.5% |
| Interquartile 25% (IQ1) | 95.7% | 98.0% |
| Interquartile 75% (IQ3) | 98.0% | 99.9% |
| Interquartile Range (IQR) | 2.3% | 1.9% |
| Standard Deviation (Sample) | 2.1% | 0.96% |
| Standard Deviation (Population) | 2.1% | 0.95% |
Similar Demographics by 2nd Grade
Demographics Similar to Immigrants from Bangladesh by 2nd Grade
In terms of 2nd grade, the demographic groups most similar to Immigrants from Bangladesh are Immigrants from Guyana (96.7%, a difference of 0.030%), Immigrants from Burma/Myanmar (96.7%, a difference of 0.030%), Vietnamese (96.7%, a difference of 0.030%), Honduran (96.7%, a difference of 0.040%), and Immigrants from Laos (96.7%, a difference of 0.040%).
| Demographics | Rating | Rank | 2nd Grade |
| Immigrants | Belize | 0.0 /100 | #315 | Tragic 96.8% |
| Hondurans | 0.0 /100 | #316 | Tragic 96.7% |
| Immigrants | Laos | 0.0 /100 | #317 | Tragic 96.7% |
| Indonesians | 0.0 /100 | #318 | Tragic 96.7% |
| Immigrants | Nicaragua | 0.0 /100 | #319 | Tragic 96.7% |
| Immigrants | Guyana | 0.0 /100 | #320 | Tragic 96.7% |
| Immigrants | Burma/Myanmar | 0.0 /100 | #321 | Tragic 96.7% |
| Immigrants | Bangladesh | 0.0 /100 | #322 | Tragic 96.7% |
| Vietnamese | 0.0 /100 | #323 | Tragic 96.7% |
| Mexican American Indians | 0.0 /100 | #324 | Tragic 96.7% |
| Dominicans | 0.0 /100 | #325 | Tragic 96.6% |
| Immigrants | Honduras | 0.0 /100 | #326 | Tragic 96.6% |
| Immigrants | Vietnam | 0.0 /100 | #327 | Tragic 96.5% |
| Mexicans | 0.0 /100 | #328 | Tragic 96.5% |
| Japanese | 0.0 /100 | #329 | Tragic 96.5% |
Demographics Similar to Chileans by 2nd Grade
In terms of 2nd grade, the demographic groups most similar to Chileans are Ugandan (97.9%, a difference of 0.0%), Spanish American (97.9%, a difference of 0.0%), Immigrants from Jordan (97.9%, a difference of 0.0%), Brazilian (97.9%, a difference of 0.0%), and Immigrants from Spain (97.9%, a difference of 0.0%).
| Demographics | Rating | Rank | 2nd Grade |
| Immigrants | Eastern Europe | 61.1 /100 | #160 | Good 97.9% |
| Immigrants | Russia | 60.3 /100 | #161 | Good 97.9% |
| Immigrants | Italy | 60.2 /100 | #162 | Good 97.9% |
| Bermudans | 59.4 /100 | #163 | Average 97.9% |
| Ugandans | 56.6 /100 | #164 | Average 97.9% |
| Spanish Americans | 56.4 /100 | #165 | Average 97.9% |
| Immigrants | Jordan | 56.3 /100 | #166 | Average 97.9% |
| Chileans | 56.1 /100 | #167 | Average 97.9% |
| Brazilians | 55.8 /100 | #168 | Average 97.9% |
| Immigrants | Spain | 55.4 /100 | #169 | Average 97.9% |
| Navajo | 54.3 /100 | #170 | Average 97.9% |
| Albanians | 52.8 /100 | #171 | Average 97.9% |
| Immigrants | Korea | 52.7 /100 | #172 | Average 97.9% |
| Kenyans | 52.7 /100 | #173 | Average 97.9% |
| Immigrants | Micronesia | 50.0 /100 | #174 | Average 97.9% |