Immigrants from Bangladesh vs Chilean Unemployment Among Women with Children Under 6 years
COMPARE
Immigrants from Bangladesh
Chilean
Unemployment Among Women with Children Under 6 years
Unemployment Among Women with Children Under 6 years Comparison
Immigrants from Bangladesh
Chileans
8.8%
UNEMPLOYMENT AMONG WOMEN WITH CHILDREN UNDER 6 YEARS
0.0/ 100
METRIC RATING
293rd/ 347
METRIC RANK
7.2%
UNEMPLOYMENT AMONG WOMEN WITH CHILDREN UNDER 6 YEARS
97.4/ 100
METRIC RATING
101st/ 347
METRIC RANK
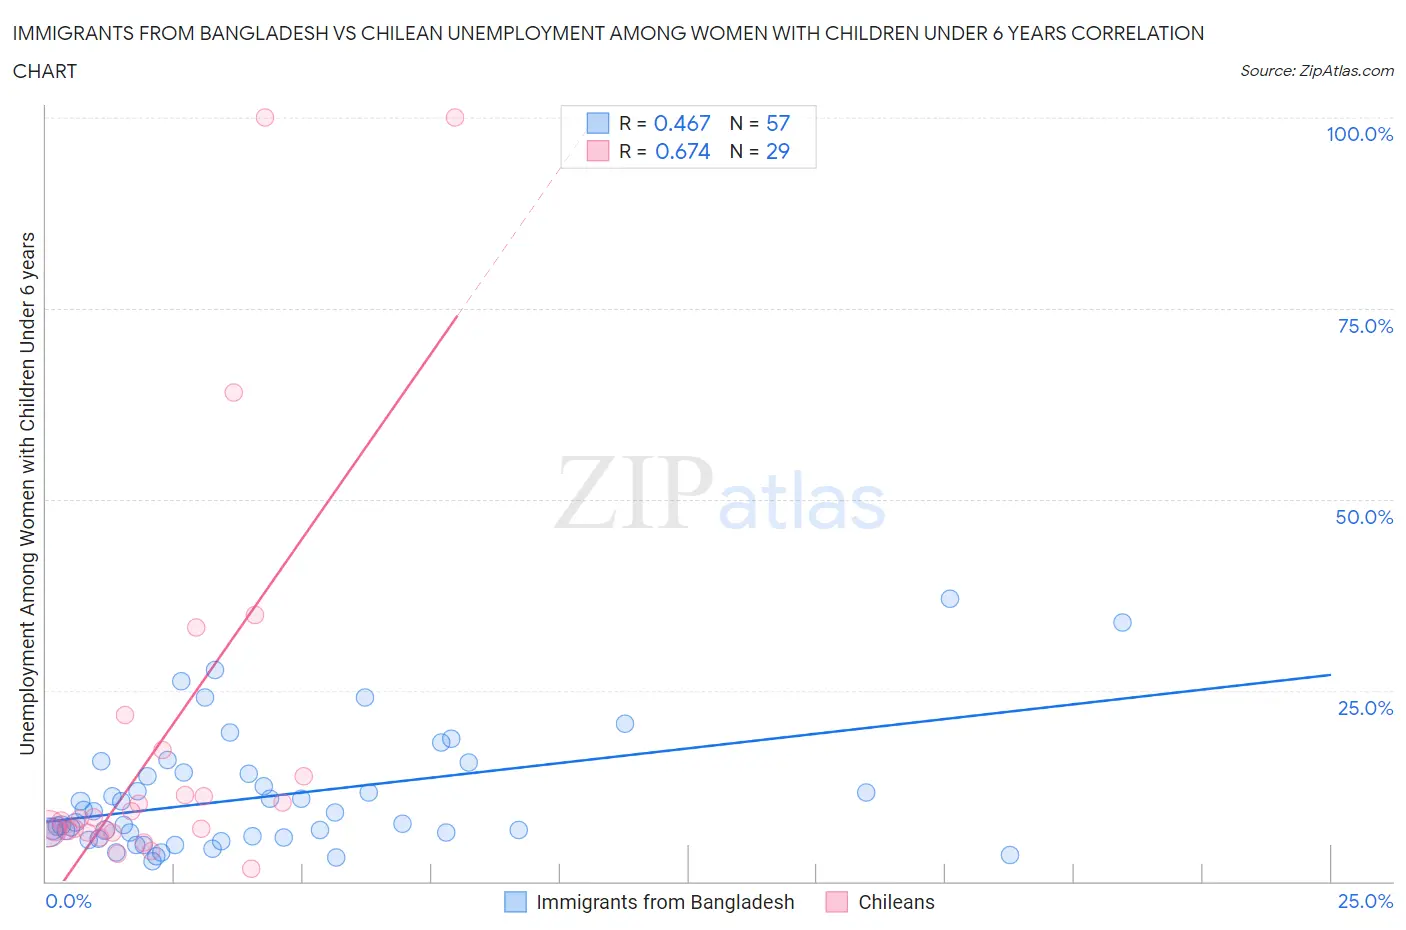
Immigrants from Bangladesh vs Chilean Unemployment Among Women with Children Under 6 years Correlation Chart
The statistical analysis conducted on geographies consisting of 173,597,971 people shows a moderate positive correlation between the proportion of Immigrants from Bangladesh and unemployment rate among women with children under the age of 6 in the United States with a correlation coefficient (R) of 0.467 and weighted average of 8.8%. Similarly, the statistical analysis conducted on geographies consisting of 212,235,383 people shows a significant positive correlation between the proportion of Chileans and unemployment rate among women with children under the age of 6 in the United States with a correlation coefficient (R) of 0.674 and weighted average of 7.2%, a difference of 22.9%.
Unemployment Among Women with Children Under 6 years Correlation Summary
| Measurement | Immigrants from Bangladesh | Chilean |
| Minimum | 2.5% | 1.6% |
| Maximum | 37.0% | 100.0% |
| Range | 34.5% | 98.4% |
| Mean | 11.1% | 18.4% |
| Median | 7.8% | 8.2% |
| Interquartile 25% (IQ1) | 5.8% | 6.5% |
| Interquartile 75% (IQ3) | 14.2% | 15.5% |
| Interquartile Range (IQR) | 8.4% | 9.0% |
| Standard Deviation (Sample) | 7.7% | 25.8% |
| Standard Deviation (Population) | 7.6% | 25.4% |
Similar Demographics by Unemployment Among Women with Children Under 6 years
Demographics Similar to Immigrants from Bangladesh by Unemployment Among Women with Children Under 6 years
In terms of unemployment among women with children under 6 years, the demographic groups most similar to Immigrants from Bangladesh are Nonimmigrants (8.8%, a difference of 0.19%), Cheyenne (8.8%, a difference of 0.23%), Immigrants from Central America (8.9%, a difference of 0.23%), Immigrants from Dominican Republic (8.9%, a difference of 0.36%), and Mexican (8.9%, a difference of 0.46%).
| Demographics | Rating | Rank | Unemployment Among Women with Children Under 6 years |
| Seminole | 0.0 /100 | #286 | Tragic 8.7% |
| Menominee | 0.0 /100 | #287 | Tragic 8.7% |
| Bahamians | 0.0 /100 | #288 | Tragic 8.7% |
| Iroquois | 0.0 /100 | #289 | Tragic 8.7% |
| Vietnamese | 0.0 /100 | #290 | Tragic 8.8% |
| Jamaicans | 0.0 /100 | #291 | Tragic 8.8% |
| Cheyenne | 0.0 /100 | #292 | Tragic 8.8% |
| Immigrants | Bangladesh | 0.0 /100 | #293 | Tragic 8.8% |
| Immigrants | Nonimmigrants | 0.0 /100 | #294 | Tragic 8.8% |
| Immigrants | Central America | 0.0 /100 | #295 | Tragic 8.9% |
| Immigrants | Dominican Republic | 0.0 /100 | #296 | Tragic 8.9% |
| Mexicans | 0.0 /100 | #297 | Tragic 8.9% |
| Tlingit-Haida | 0.0 /100 | #298 | Tragic 8.9% |
| Immigrants | Jamaica | 0.0 /100 | #299 | Tragic 8.9% |
| Creek | 0.0 /100 | #300 | Tragic 8.9% |
Demographics Similar to Chileans by Unemployment Among Women with Children Under 6 years
In terms of unemployment among women with children under 6 years, the demographic groups most similar to Chileans are Immigrants from Northern Europe (7.2%, a difference of 0.020%), Immigrants from Nicaragua (7.2%, a difference of 0.030%), Immigrants from Saudi Arabia (7.2%, a difference of 0.030%), Immigrants from Europe (7.2%, a difference of 0.070%), and Russian (7.2%, a difference of 0.11%).
| Demographics | Rating | Rank | Unemployment Among Women with Children Under 6 years |
| Macedonians | 97.7 /100 | #94 | Exceptional 7.2% |
| Romanians | 97.7 /100 | #95 | Exceptional 7.2% |
| Immigrants | Eastern Africa | 97.7 /100 | #96 | Exceptional 7.2% |
| Immigrants | South Eastern Asia | 97.6 /100 | #97 | Exceptional 7.2% |
| Russians | 97.5 /100 | #98 | Exceptional 7.2% |
| Immigrants | Europe | 97.5 /100 | #99 | Exceptional 7.2% |
| Immigrants | Northern Europe | 97.4 /100 | #100 | Exceptional 7.2% |
| Chileans | 97.4 /100 | #101 | Exceptional 7.2% |
| Immigrants | Nicaragua | 97.3 /100 | #102 | Exceptional 7.2% |
| Immigrants | Saudi Arabia | 97.3 /100 | #103 | Exceptional 7.2% |
| Immigrants | Egypt | 97.2 /100 | #104 | Exceptional 7.2% |
| Venezuelans | 97.2 /100 | #105 | Exceptional 7.2% |
| Immigrants | Pakistan | 97.2 /100 | #106 | Exceptional 7.2% |
| Immigrants | Kazakhstan | 97.1 /100 | #107 | Exceptional 7.2% |
| Eastern Europeans | 96.9 /100 | #108 | Exceptional 7.2% |