Immigrants from Austria vs Taiwanese 6th Grade
COMPARE
Immigrants from Austria
Taiwanese
6th Grade
6th Grade Comparison
Immigrants from Austria
Taiwanese
97.7%
6TH GRADE
99.6/ 100
METRIC RATING
68th/ 347
METRIC RANK
96.5%
6TH GRADE
0.5/ 100
METRIC RATING
257th/ 347
METRIC RANK
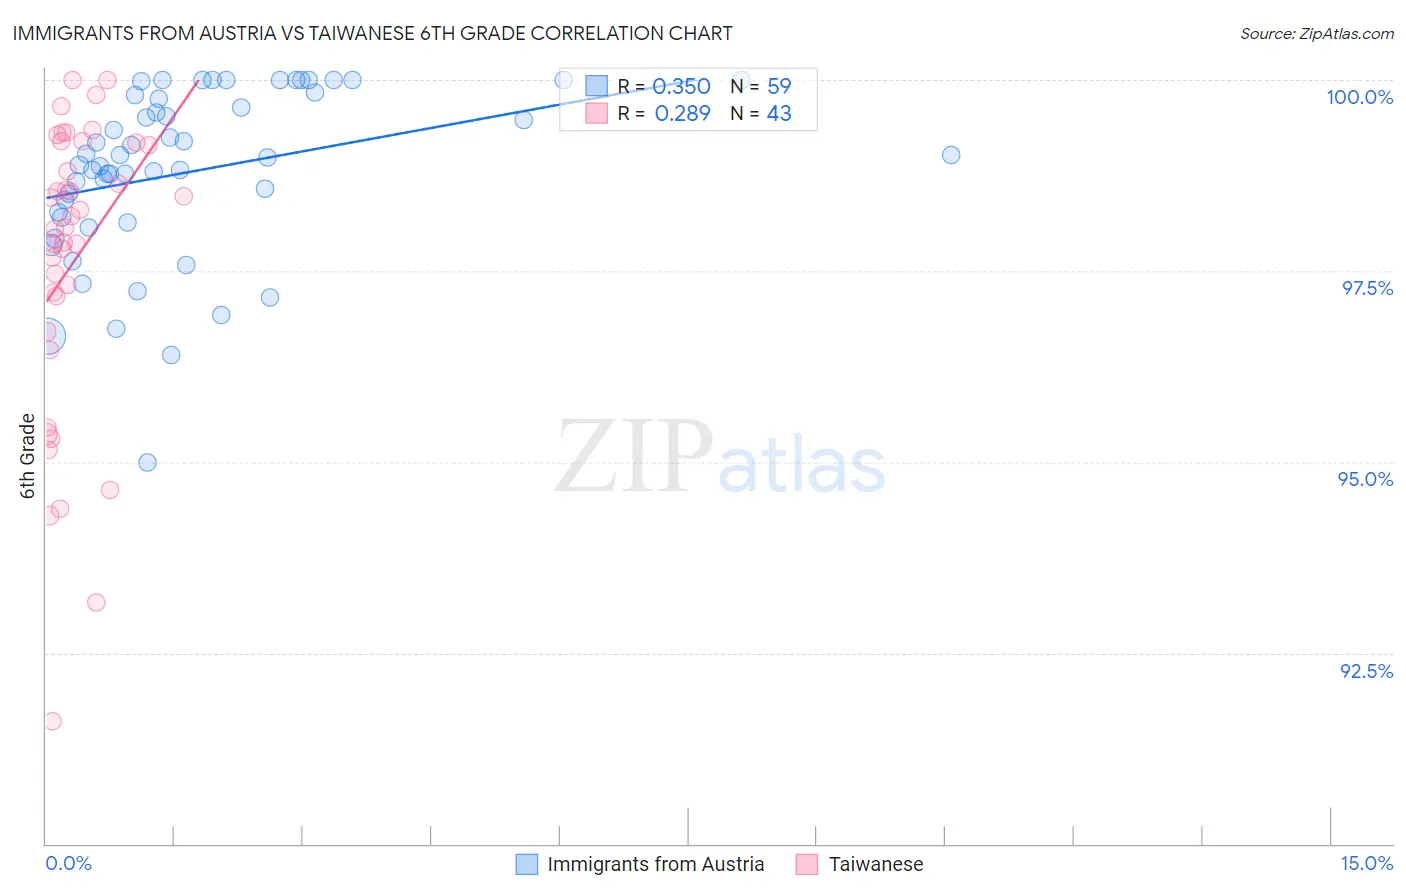
Immigrants from Austria vs Taiwanese 6th Grade Correlation Chart
The statistical analysis conducted on geographies consisting of 167,973,800 people shows a mild positive correlation between the proportion of Immigrants from Austria and percentage of population with at least 6th grade education in the United States with a correlation coefficient (R) of 0.350 and weighted average of 97.7%. Similarly, the statistical analysis conducted on geographies consisting of 31,677,387 people shows a weak positive correlation between the proportion of Taiwanese and percentage of population with at least 6th grade education in the United States with a correlation coefficient (R) of 0.289 and weighted average of 96.5%, a difference of 1.3%.
6th Grade Correlation Summary
| Measurement | Immigrants from Austria | Taiwanese |
| Minimum | 95.0% | 91.6% |
| Maximum | 100.0% | 100.0% |
| Range | 5.0% | 8.4% |
| Mean | 98.8% | 97.6% |
| Median | 99.0% | 98.1% |
| Interquartile 25% (IQ1) | 98.2% | 96.7% |
| Interquartile 75% (IQ3) | 99.8% | 99.2% |
| Interquartile Range (IQR) | 1.6% | 2.5% |
| Standard Deviation (Sample) | 1.1% | 2.0% |
| Standard Deviation (Population) | 1.1% | 1.9% |
Similar Demographics by 6th Grade
Demographics Similar to Immigrants from Austria by 6th Grade
In terms of 6th grade, the demographic groups most similar to Immigrants from Austria are New Zealander (97.7%, a difference of 0.0%), Kiowa (97.7%, a difference of 0.0%), Immigrants from Northern Europe (97.7%, a difference of 0.010%), Russian (97.7%, a difference of 0.020%), and Canadian (97.7%, a difference of 0.020%).
| Demographics | Rating | Rank | 6th Grade |
| Serbians | 99.7 /100 | #61 | Exceptional 97.7% |
| Immigrants | North America | 99.7 /100 | #62 | Exceptional 97.7% |
| Russians | 99.7 /100 | #63 | Exceptional 97.7% |
| Canadians | 99.7 /100 | #64 | Exceptional 97.7% |
| Immigrants | Northern Europe | 99.6 /100 | #65 | Exceptional 97.7% |
| New Zealanders | 99.6 /100 | #66 | Exceptional 97.7% |
| Kiowa | 99.6 /100 | #67 | Exceptional 97.7% |
| Immigrants | Austria | 99.6 /100 | #68 | Exceptional 97.7% |
| Iranians | 99.6 /100 | #69 | Exceptional 97.6% |
| Cajuns | 99.5 /100 | #70 | Exceptional 97.6% |
| Chickasaw | 99.5 /100 | #71 | Exceptional 97.6% |
| Macedonians | 99.4 /100 | #72 | Exceptional 97.6% |
| Cherokee | 99.4 /100 | #73 | Exceptional 97.6% |
| Immigrants | Netherlands | 99.4 /100 | #74 | Exceptional 97.6% |
| Ukrainians | 99.4 /100 | #75 | Exceptional 97.6% |
Demographics Similar to Taiwanese by 6th Grade
In terms of 6th grade, the demographic groups most similar to Taiwanese are Immigrants from China (96.4%, a difference of 0.010%), Immigrants from Ethiopia (96.5%, a difference of 0.020%), Immigrants from Congo (96.5%, a difference of 0.020%), U.S. Virgin Islander (96.5%, a difference of 0.020%), and South American (96.4%, a difference of 0.020%).
| Demographics | Rating | Rank | 6th Grade |
| Immigrants | Middle Africa | 0.8 /100 | #250 | Tragic 96.5% |
| Immigrants | Senegal | 0.7 /100 | #251 | Tragic 96.5% |
| Immigrants | Uruguay | 0.6 /100 | #252 | Tragic 96.5% |
| Jamaicans | 0.6 /100 | #253 | Tragic 96.5% |
| Immigrants | Ethiopia | 0.6 /100 | #254 | Tragic 96.5% |
| Immigrants | Congo | 0.6 /100 | #255 | Tragic 96.5% |
| U.S. Virgin Islanders | 0.5 /100 | #256 | Tragic 96.5% |
| Taiwanese | 0.5 /100 | #257 | Tragic 96.5% |
| Immigrants | China | 0.4 /100 | #258 | Tragic 96.4% |
| South Americans | 0.4 /100 | #259 | Tragic 96.4% |
| Peruvians | 0.4 /100 | #260 | Tragic 96.4% |
| Immigrants | Sierra Leone | 0.4 /100 | #261 | Tragic 96.4% |
| Immigrants | Nigeria | 0.3 /100 | #262 | Tragic 96.4% |
| Immigrants | Colombia | 0.3 /100 | #263 | Tragic 96.4% |
| Armenians | 0.3 /100 | #264 | Tragic 96.4% |