Welsh vs Taiwanese 6th Grade
COMPARE
Welsh
Taiwanese
6th Grade
6th Grade Comparison
Welsh
Taiwanese
98.5%
6TH GRADE
100.0/ 100
METRIC RATING
3rd/ 347
METRIC RANK
96.5%
6TH GRADE
0.5/ 100
METRIC RATING
257th/ 347
METRIC RANK
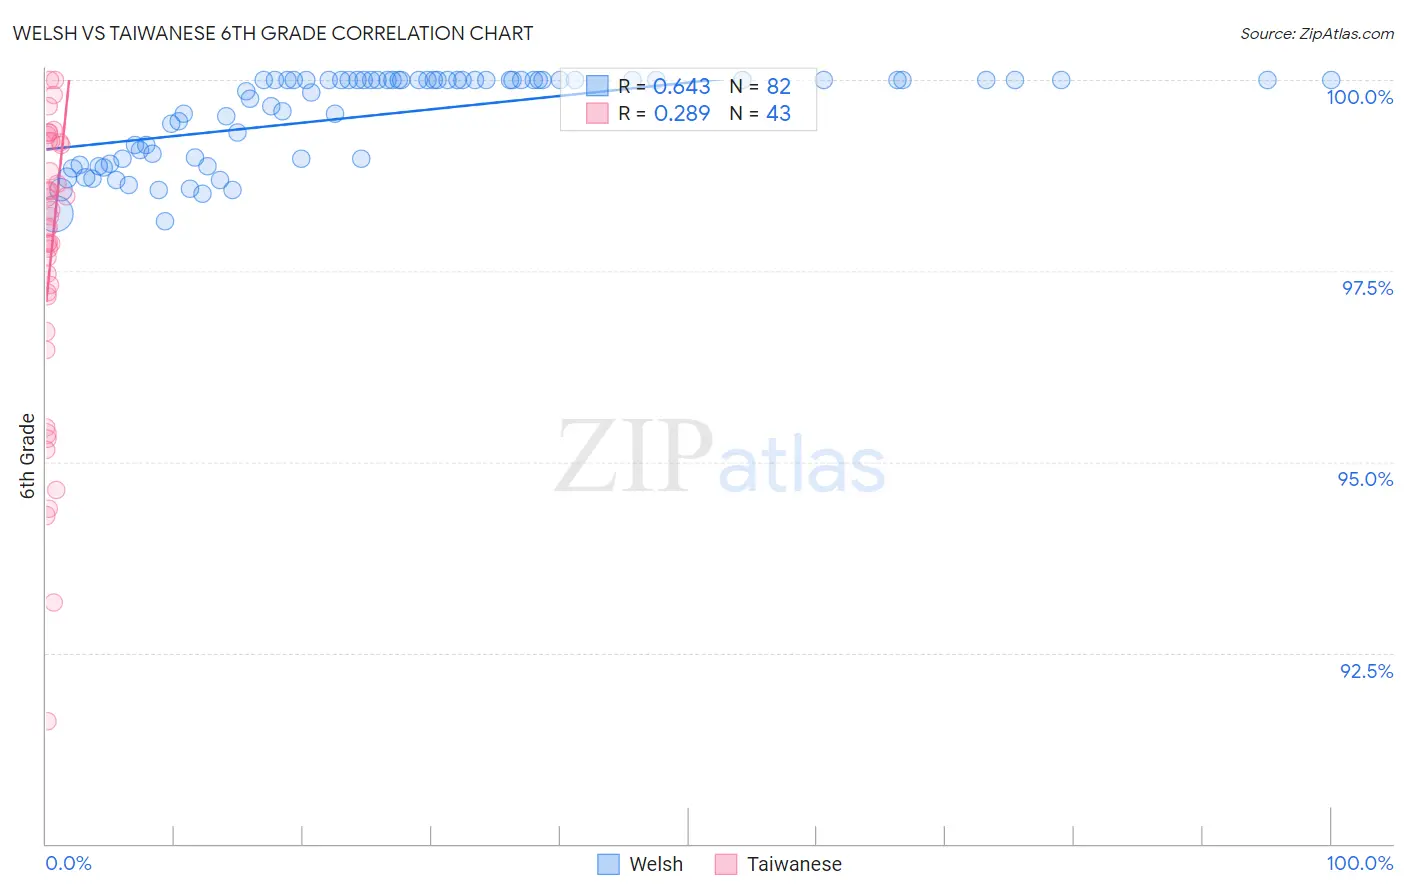
Welsh vs Taiwanese 6th Grade Correlation Chart
The statistical analysis conducted on geographies consisting of 239,959,962 people shows a significant positive correlation between the proportion of Welsh and percentage of population with at least 6th grade education in the United States with a correlation coefficient (R) of 0.643 and weighted average of 98.5%. Similarly, the statistical analysis conducted on geographies consisting of 31,677,387 people shows a weak positive correlation between the proportion of Taiwanese and percentage of population with at least 6th grade education in the United States with a correlation coefficient (R) of 0.289 and weighted average of 96.5%, a difference of 2.1%.
6th Grade Correlation Summary
| Measurement | Welsh | Taiwanese |
| Minimum | 98.1% | 91.6% |
| Maximum | 100.0% | 100.0% |
| Range | 1.9% | 8.4% |
| Mean | 99.5% | 97.6% |
| Median | 100.0% | 98.1% |
| Interquartile 25% (IQ1) | 99.0% | 96.7% |
| Interquartile 75% (IQ3) | 100.0% | 99.2% |
| Interquartile Range (IQR) | 1.0% | 2.5% |
| Standard Deviation (Sample) | 0.58% | 2.0% |
| Standard Deviation (Population) | 0.58% | 1.9% |
Similar Demographics by 6th Grade
Demographics Similar to Welsh by 6th Grade
In terms of 6th grade, the demographic groups most similar to Welsh are Ottawa (98.5%, a difference of 0.010%), Dutch (98.4%, a difference of 0.13%), Tsimshian (98.3%, a difference of 0.20%), Norwegian (98.3%, a difference of 0.21%), and German (98.2%, a difference of 0.24%).
| Demographics | Rating | Rank | 6th Grade |
| Crow | 100.0 /100 | #1 | Exceptional 99.4% |
| Ottawa | 100.0 /100 | #2 | Exceptional 98.5% |
| Welsh | 100.0 /100 | #3 | Exceptional 98.5% |
| Dutch | 100.0 /100 | #4 | Exceptional 98.4% |
| Tsimshian | 100.0 /100 | #5 | Exceptional 98.3% |
| Norwegians | 100.0 /100 | #6 | Exceptional 98.3% |
| Germans | 100.0 /100 | #7 | Exceptional 98.2% |
| Slovaks | 100.0 /100 | #8 | Exceptional 98.2% |
| Slovenes | 100.0 /100 | #9 | Exceptional 98.2% |
| Swedes | 100.0 /100 | #10 | Exceptional 98.2% |
| English | 100.0 /100 | #11 | Exceptional 98.1% |
| Alaskan Athabascans | 100.0 /100 | #12 | Exceptional 98.1% |
| Tlingit-Haida | 100.0 /100 | #13 | Exceptional 98.1% |
| Carpatho Rusyns | 100.0 /100 | #14 | Exceptional 98.1% |
| Inupiat | 100.0 /100 | #15 | Exceptional 98.1% |
Demographics Similar to Taiwanese by 6th Grade
In terms of 6th grade, the demographic groups most similar to Taiwanese are Immigrants from China (96.4%, a difference of 0.010%), Immigrants from Ethiopia (96.5%, a difference of 0.020%), Immigrants from Congo (96.5%, a difference of 0.020%), U.S. Virgin Islander (96.5%, a difference of 0.020%), and South American (96.4%, a difference of 0.020%).
| Demographics | Rating | Rank | 6th Grade |
| Immigrants | Middle Africa | 0.8 /100 | #250 | Tragic 96.5% |
| Immigrants | Senegal | 0.7 /100 | #251 | Tragic 96.5% |
| Immigrants | Uruguay | 0.6 /100 | #252 | Tragic 96.5% |
| Jamaicans | 0.6 /100 | #253 | Tragic 96.5% |
| Immigrants | Ethiopia | 0.6 /100 | #254 | Tragic 96.5% |
| Immigrants | Congo | 0.6 /100 | #255 | Tragic 96.5% |
| U.S. Virgin Islanders | 0.5 /100 | #256 | Tragic 96.5% |
| Taiwanese | 0.5 /100 | #257 | Tragic 96.5% |
| Immigrants | China | 0.4 /100 | #258 | Tragic 96.4% |
| South Americans | 0.4 /100 | #259 | Tragic 96.4% |
| Peruvians | 0.4 /100 | #260 | Tragic 96.4% |
| Immigrants | Sierra Leone | 0.4 /100 | #261 | Tragic 96.4% |
| Immigrants | Nigeria | 0.3 /100 | #262 | Tragic 96.4% |
| Immigrants | Colombia | 0.3 /100 | #263 | Tragic 96.4% |
| Armenians | 0.3 /100 | #264 | Tragic 96.4% |