Immigrants from Austria vs Czech Bachelor's Degree
COMPARE
Immigrants from Austria
Czech
Bachelor's Degree
Bachelor's Degree Comparison
Immigrants from Austria
Czechs
44.2%
BACHELOR'S DEGREE
99.9/ 100
METRIC RATING
54th/ 347
METRIC RANK
38.0%
BACHELOR'S DEGREE
54.4/ 100
METRIC RATING
170th/ 347
METRIC RANK
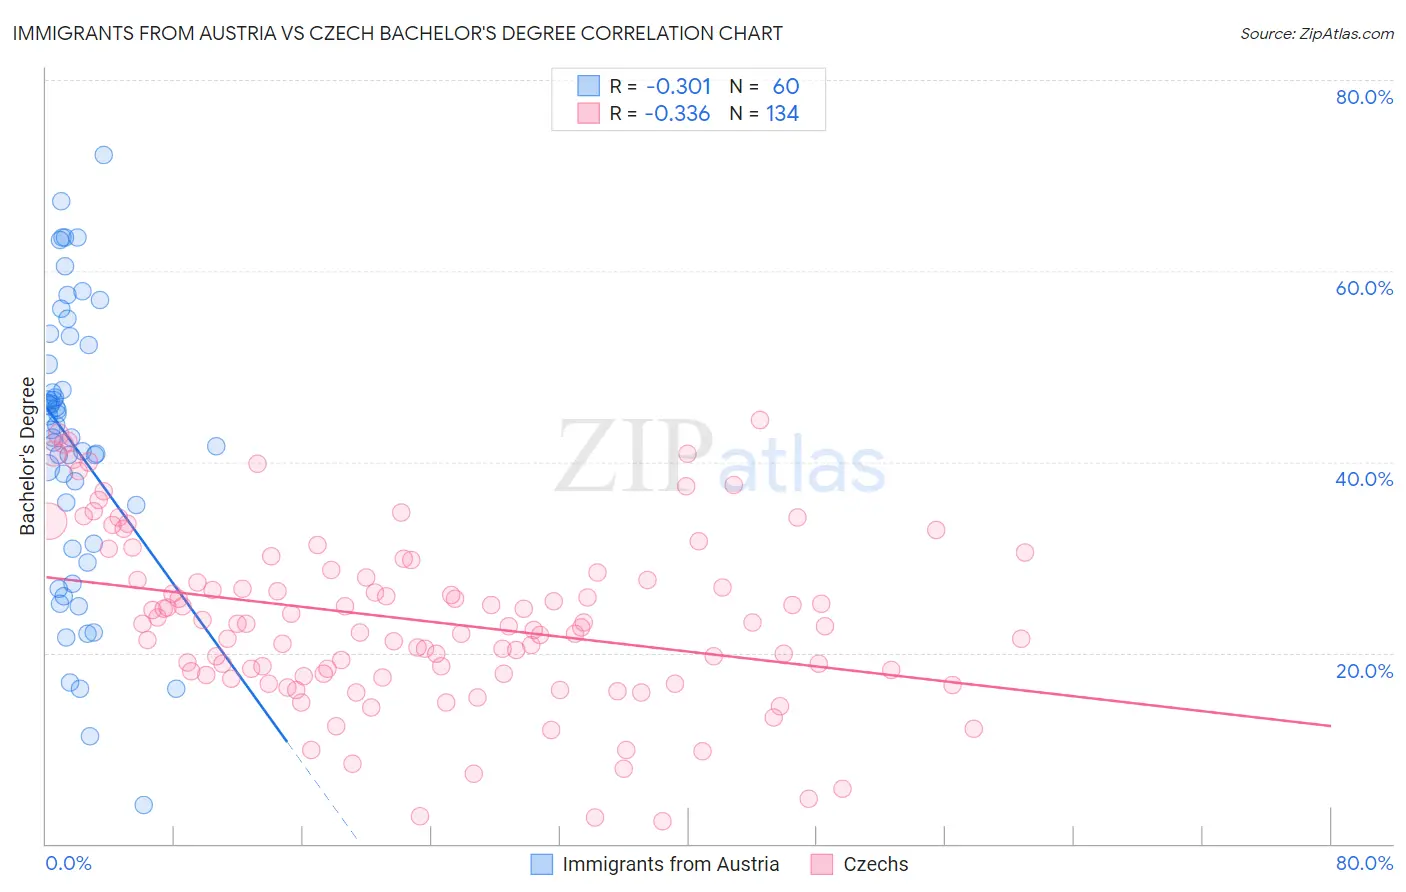
Immigrants from Austria vs Czech Bachelor's Degree Correlation Chart
The statistical analysis conducted on geographies consisting of 167,971,732 people shows a mild negative correlation between the proportion of Immigrants from Austria and percentage of population with at least bachelor's degree education in the United States with a correlation coefficient (R) of -0.301 and weighted average of 44.2%. Similarly, the statistical analysis conducted on geographies consisting of 484,759,753 people shows a mild negative correlation between the proportion of Czechs and percentage of population with at least bachelor's degree education in the United States with a correlation coefficient (R) of -0.336 and weighted average of 38.0%, a difference of 16.4%.
Bachelor's Degree Correlation Summary
| Measurement | Immigrants from Austria | Czech |
| Minimum | 4.1% | 2.4% |
| Maximum | 72.2% | 44.4% |
| Range | 68.1% | 42.1% |
| Mean | 41.7% | 23.4% |
| Median | 43.0% | 22.9% |
| Interquartile 25% (IQ1) | 31.2% | 17.8% |
| Interquartile 75% (IQ3) | 51.2% | 28.5% |
| Interquartile Range (IQR) | 20.0% | 10.6% |
| Standard Deviation (Sample) | 14.7% | 9.0% |
| Standard Deviation (Population) | 14.6% | 9.0% |
Similar Demographics by Bachelor's Degree
Demographics Similar to Immigrants from Austria by Bachelor's Degree
In terms of bachelor's degree, the demographic groups most similar to Immigrants from Austria are Immigrants from Bolivia (44.2%, a difference of 0.0%), Immigrants from Asia (44.3%, a difference of 0.19%), Immigrants from Serbia (44.1%, a difference of 0.19%), Immigrants from Spain (44.3%, a difference of 0.24%), and Paraguayan (44.0%, a difference of 0.37%).
| Demographics | Rating | Rank | Bachelor's Degree |
| Bolivians | 99.9 /100 | #47 | Exceptional 44.6% |
| Estonians | 99.9 /100 | #48 | Exceptional 44.6% |
| Immigrants | Norway | 99.9 /100 | #49 | Exceptional 44.5% |
| Immigrants | Greece | 99.9 /100 | #50 | Exceptional 44.5% |
| Asians | 99.9 /100 | #51 | Exceptional 44.4% |
| Immigrants | Spain | 99.9 /100 | #52 | Exceptional 44.3% |
| Immigrants | Asia | 99.9 /100 | #53 | Exceptional 44.3% |
| Immigrants | Austria | 99.9 /100 | #54 | Exceptional 44.2% |
| Immigrants | Bolivia | 99.9 /100 | #55 | Exceptional 44.2% |
| Immigrants | Serbia | 99.9 /100 | #56 | Exceptional 44.1% |
| Paraguayans | 99.9 /100 | #57 | Exceptional 44.0% |
| Immigrants | Czechoslovakia | 99.9 /100 | #58 | Exceptional 44.0% |
| Australians | 99.9 /100 | #59 | Exceptional 44.0% |
| New Zealanders | 99.9 /100 | #60 | Exceptional 44.0% |
| South Africans | 99.8 /100 | #61 | Exceptional 43.6% |
Demographics Similar to Czechs by Bachelor's Degree
In terms of bachelor's degree, the demographic groups most similar to Czechs are Bermudan (38.0%, a difference of 0.010%), Ghanaian (38.0%, a difference of 0.10%), Immigrants from Somalia (37.9%, a difference of 0.15%), Danish (38.1%, a difference of 0.18%), and Immigrants from Iraq (37.9%, a difference of 0.18%).
| Demographics | Rating | Rank | Bachelor's Degree |
| Peruvians | 63.4 /100 | #163 | Good 38.3% |
| Hungarians | 62.1 /100 | #164 | Good 38.3% |
| Sri Lankans | 59.1 /100 | #165 | Average 38.2% |
| Somalis | 58.6 /100 | #166 | Average 38.1% |
| Scottish | 56.6 /100 | #167 | Average 38.1% |
| Danes | 56.2 /100 | #168 | Average 38.1% |
| Ghanaians | 55.3 /100 | #169 | Average 38.0% |
| Czechs | 54.4 /100 | #170 | Average 38.0% |
| Bermudans | 54.2 /100 | #171 | Average 38.0% |
| Immigrants | Somalia | 52.8 /100 | #172 | Average 37.9% |
| Immigrants | Iraq | 52.5 /100 | #173 | Average 37.9% |
| Immigrants | Bangladesh | 50.0 /100 | #174 | Average 37.8% |
| Immigrants | Uruguay | 48.3 /100 | #175 | Average 37.8% |
| Costa Ricans | 47.6 /100 | #176 | Average 37.7% |
| Basques | 47.4 /100 | #177 | Average 37.7% |